Base Guide 7.2
Chapter 6
Reports
This document is Copyright © 2021 by the LibreOffice Documentation Team. Contributors are listed below. You may distribute it and/or modify it under the terms of either the GNU General Public License (https://www.gnu.org/licenses/gpl.html), version 3 or later, or the Creative Commons Attribution License (https://creativecommons.org/licenses/by/4.0/), version 4.0 or later.
All trademarks within this guide belong to their legitimate owners.
|
Pulkit Krishna |
|
|
|
Robert Großkopf |
Pulkit Krishna |
Jost Lange |
|
Dan Lewis |
Hazel Russman |
Jochen Schiffers |
|
Jean Hollis Weber |
|
|
Please direct any comments or suggestions about this document to the Documentation Team’s mailing list: documentation@global.libreoffice.org.
Note
Everything you send to a mailing list, including your email address and any other personal information that is written in the message, is publicly archived and cannot be deleted.
Published December 2021. Based on LibreOffice 7.2 Community.
Other versions of LibreOffice may differ in appearance and functionality.
Reports are used to present data in a way that makes it readily understood by people without knowledge of the database. Reports can:
Present data in easy-to-read tables
Create charts for displaying data
Make it possible to use data for printing labels
Produce form letters such as bills, recall notices, or notifications to people joining or leaving an association
To create a report requires careful preparatory work on the underlying database. Unlike a form, a report cannot include subreports and thus incorporate additional data sources. Neither can a report present different data elements than those that are available in the underlying data source, as a form can do using list boxes.
Reports are best prepared using queries. In this way all variables can be determined. In particular, if sorting within the report is required, always use a query that makes provision for sorting. This means that queries in direct SQL mode should be avoided under these conditions. If you must use a query of this type in your database, you can carry out the sort by first creating a view from the query. Such a view can always be sorted and filtered using the graphical user interface (GUI) of Base.
Caution
When using the Report Builder, you should frequently save your work during editing. In addition to saving within the Report Builder itself after each significant step, you should also save the whole database.
Depending on the version of LibreOffice that you are using, the Report Builder can sometimes crash during editing.
The functionality of completed reports is not affected even if they were created under another version, in which the problem does not occur.
Note
Since LibreOffice 4.1, the Report Builder has been fully integrated and no longer appears under Extensions. It is essential that you do not install a Report Builder extension that does not match your version alongside the integrated Report Builder.
To start the Report Builder from within Base, use Reports > Create Report in Design View.
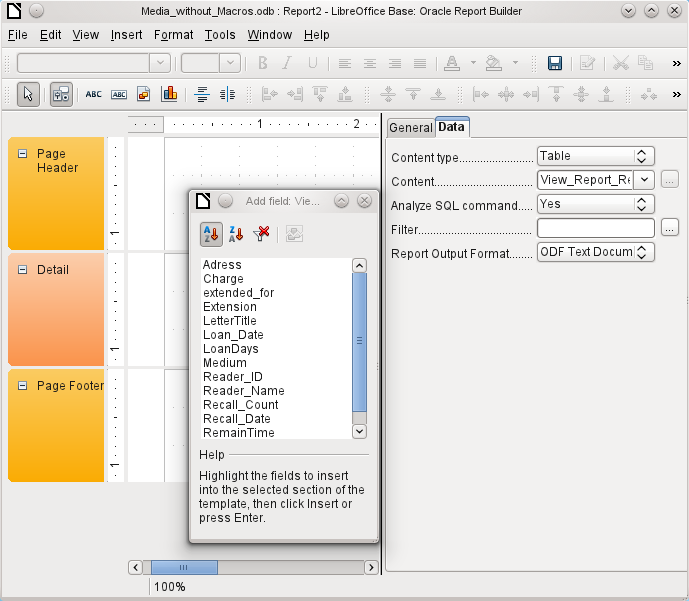
The initial window of the Report Builder (Figure 1) shows three parts. On the left is the current division of the report into Page header, Detail, and Page footer; in the middle are the corresponding areas where the content will be entered; and, to the right, the properties of these regions are shown.
At the same time the Add fields dialog is displayed. This dialog corresponds to the one in form creation. It creates fields with their corresponding field labels.
Without content from the database, a report has no proper function. For this reason, the dialog opens at the Data tab. Here you can set the content of the report; in the example it is the View_Report_Recall table. As long as Analyze SQL command is set to Yes, the report can be subjected to sorting, grouping, and filtering. A view has been chosen for the basis of this report, so no filter will be applied; it has already been included in the query underlying the view.
Figure 1: Initial window of Report Builder
Note
The content type provided can be a table, a view, a query or direct SQL coding. The Report Builder works best when it is given data that have been prepared in advance as far as possible. So, for example, calculations in queries can be carried out in advance and the scope of records that are to appear in the report limited where necessary.
In earlier LibreOffice versions there were sometimes problems when queries involving more than one table are to be grouped later. Such problems could be avoided if you use a view rather than a query. A view looks like a database table to program elements like the Report Builder. Field names are predefined and fixed and a subsequent access using sorting and grouping commands is possible without causing errors.
Two output formats for reports are available for selection: ODF Text document (a Writer document) or ODF Spreadsheet (a Calc document). If you just want a tabular view of your data, the Calc document should definitely be chosen for your report. It is significantly faster to create and is also easier to format subsequently, as there are fewer options to consider and columns can easily be dragged to the required width afterward.
By default, the Report Builder looks for its data source in the first table in the database. This ensures that at least a test of the functions is possible. A data source has to be chosen before the report can be provided with fields.
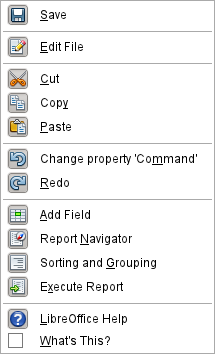
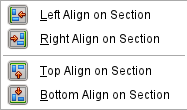
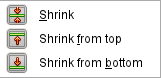
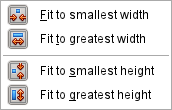
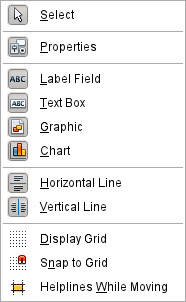
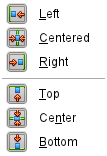
The Report Builder provides a lot of additional buttons, so the table on the next page shows the buttons with their descriptions. The buttons for aligning elements are not further described in this chapter. They are useful for quick adjustment of fields in a single area of the Report Builder, but in principle everything can be done by direct editing of field properties.
|
Buttons for editing content |
Buttons for aligning elements |
|
|
|
|
|
|
|
|
|
|
|
|
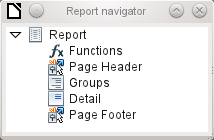
Just as with forms, it is helpful to use the appropriate navigator. So, for example, a careless click at the start of the Report Builder can make it difficult to find the properties of the data for the report. Such data may only be reachable through the report navigator. Left-click on Report and the properties of the report are once more accessible.
Initially the navigator shows, in addition to the visible sections of the document (Page Header, Groups, Detail, and Page Footer), the possibility of including functions. Groups can be used, for example, to assign all media being recalled to the person who has borrowed them, to avoid multiple recall notices. Detail areas show the records belonging to a group. Functions are used for calculations such as sums.
To obtain useful output in the above example, the content of the view must be reproduced with suitable grouping. Each reader should be linked to the recall notices for all of their loaned and overdue media.
View > Sorting and Grouping or the corresponding button starts the grouping function.
Figure 2: Sorting and Grouping
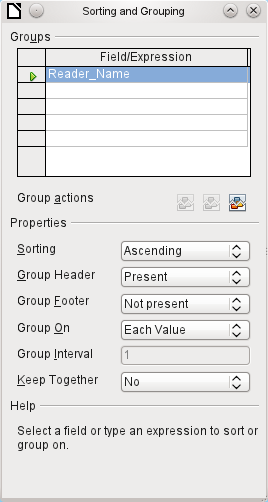
Here grouping and sorting are by the Reader_Name field. Additional fields could also be included in the table above. For example, if you also want to group and sort by the Loan_Date field, choose this as the second line.
Directly under the table, several grouping actions are available for selection. You can move a group up or down the list or completely remove it. As only one group is necessary for the planned report, Figure 2 shows only the Delete symbol at the extreme right of the group actions as available.
The Sorting property is self-explanatory.
When the entry was created, the left side of the Report Builder immediately showed a new division. Next to the field description Reader_Name you can now see Header. This section is for the group header in the report. The header might contain the name of the person who will receive the recall notice. In this case there is no group footer. Such a footer could contain the fine due, or the place and current date and a space for the signature of the person sending the notice.
By default there is a new group for each value. So if the Reader_Name changes, a new group is started. Alternatively you can group by initial letter. In the case of a recall notice, however, this would put all readers with the same initial together in one group. Schmidt, Schulze, and Schulte would receive a common recall notice, which would be quite pointless in this example.
When grouping by initial letter, you can additionally specify how many letters later the next group should begin. One can imagine for example a grouping for a small telephone directory. According to the size of the contact list, one might imagine a grouping on every second initial letter. So A and B would form the first group, then C and D, and so on.
A group can be set either to be kept together with the first details section, or, as far as possible, as a complete group. By default, this option is set to No. For recall notices, you would probably want the group to be arranged so that a separate page is printed for each person who is to receive a recall letter. In another menu, you can choose that each group (in this case, each reader name) be followed by a page break before dealing with the next value.
If you have chosen to have a group header and perhaps a group footer, these elements will appear as sections in the report navigator under the corresponding fieldname Reader_Name. Here too you have the possibility of using functions, which will then be limited to this group.
To add fields, use the Add field function, as with forms. However in this case, the label and the field contents are not tied together. Both can be independently moved, changed in size and dragged to different sections.
Figure 3 shows the report design for the recall notice. In the page header is the heading Libre Office Library, inserted as a label field. Here you could also have a letterhead with a logo, since graphics can be included. This level is called Page Header, but that does not imply there is no space above it. That depends on the page settings; if an upper margin has been set, it lies above the page header.
Reader_Name Header is the header for the grouped and sorted data. In the fields that are to contain data, the names of the corresponding data fields are shown in light gray. So, for example, the view underlying the report has a field named Address, containing the complete address of the recipient with street and town. To put this into a single field requires line breaks in the query. You can use CHAR(13)||CHAR(10) to create them.
Example:
SELECT "Salutation"||CHAR(13)||CHAR(10)||"FirstName"||' '||"LastName"||CHAR(13)||CHAR(10)||"Street"||' '||"No"||CHAR13||CHAR(10)||"Postcode"||' '||"Town" AS "Adress" FROM "Reader"
The =TODAY() field represents a built-in function, which inserts the current date into this position.
In Reader_Name Header, in addition to the salutation, we see the column headings for the following table view. These elements should appear only once, even if several media are listed.
Figure 3: Report design for example recall notice
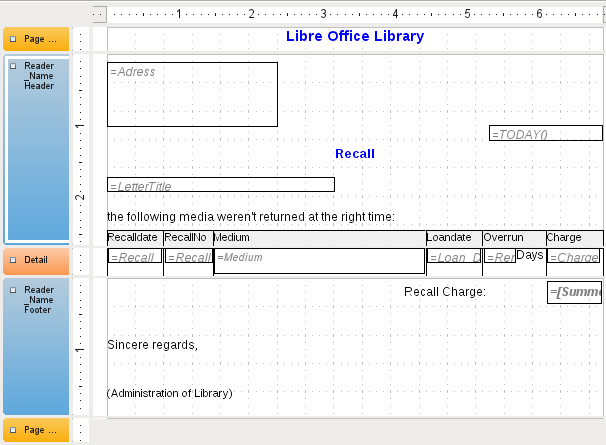
In the background of these column headers is a gray rectangle, which also serves as a frame for the data.
The Details area is repeated as often as there are separate records with the same Reader_Name data. Here are listed all media that have not been returned on time. There is another rectangle in the background to frame the contents. This rectangle is filled with white rather than gray.
Note
In principle LibreOffice provides for the possibility of adding horizontal and vertical lines. These lines have the disadvantage that they are interpreted only as hairlines. They can be reproduced better if rectangles are used. Set the background of the rectangle to black and the size to, for example, 17cm wide and 0.03cm high. This will create a horizontal line with a thickness of 0.03cm and a length of 17cm.
Unfortunately this variant also has a disadvantage: graphical elements cannot be positioned correctly if the area stretches over more than one page.
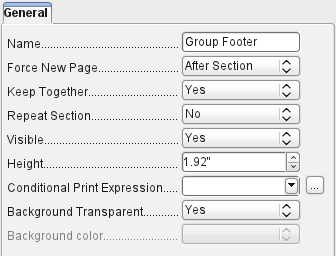
The Reader_Name Footer closes the letter with a greeting formula and an area for the signature. The footer is so defined that an additional page break will occur after this area. Also, contrary to the default setup, it is specified that this area should be kept together in all cases. After all, it would look rather odd if many recall notices had the signature on a separate page.
Keep together refers here to the page break. If you want the content of a record to be kept together independently of the break, this is only possible at present if the record is not read in as Details but is used as the basis for a grouping. You can choose Keep together = Yes, but it does not work; the Details area becomes separated. You have to put the content of Details in a separate group to keep it together.
A built-in function is used for calculating the total fines.
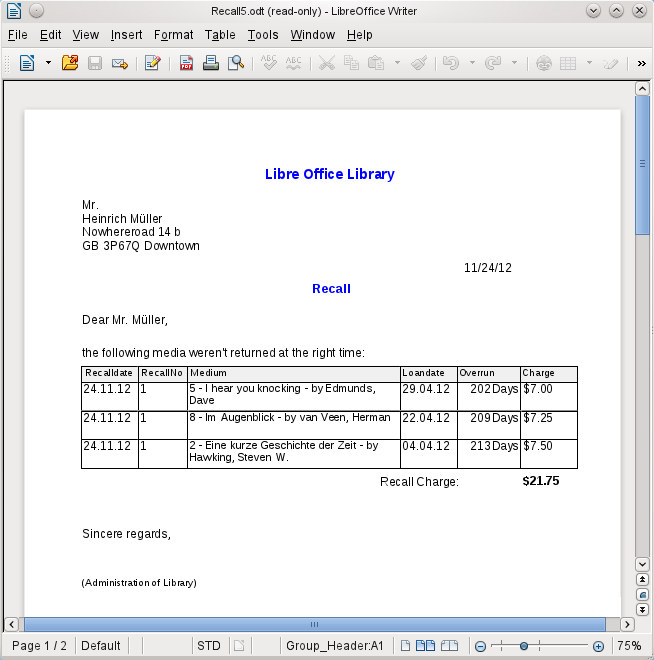
Below is what an actual recall notice would look like. The details area contains 5 media that the reader has taken out on loan. The group footer contains the total fine due.
Note
Reports for single records can also extend over more than one page. The size of the report is quite separate from the page size. However, stretching the details area over more than one page can lead to faulty breaks. Here the Report Builder still has problems in calculating the spacing correctly. If both grouping areas and graphical elements are included, this may result in unpredictable sizes for certain areas.
So far individual elements can be moved to positions outside the size of a single page only with the mouse and cursor keys. The properties of the elements always provide the same maximum distance from the upper corner of any area that lies on the first page.
There are only three types of field for the presentation of data. In addition to text fields (which, contrary to their name, can also contain numbers and formatting), there is also a field type that can contain images from the database. The chart field displays a summary of data.
As with forms, fields are given names. By default, the name is that of the underlying database field.
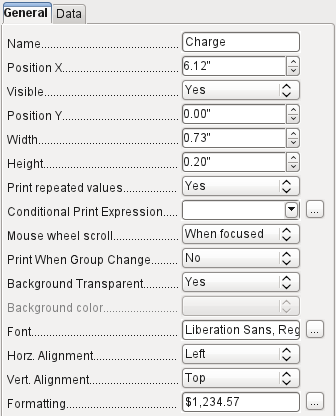
A field can be set to be invisible. This may seem a bit pointless in the case of fields but is useful for group headers and footers, which may be required to carry out other functions of the grouping without containing anything that needs to be displayed.
If Print repeated values is deactivated, display of the field is inhibited when a field with the same content is loaded directly before. This functions correctly only for data fields that contain text. Numeric fields or date fields ignore the deactivation instruction, Label fields are completely faded out when deactivated, even if they occur only once.
In the Report Builder the display of certain content can be inhibited by using Conditional Print Expression or the value of the field can be used as a base for formatting text and background. More on conditional expressions is given in “Conditional print” on page 1.
The setting for the mouse wheel has no effect because report fields are not editable. It seems to be a leftover from the form definition dialog.
The Print When Group Change function could not be reproduced in reports either.
If the background is not defined as transparent, a background color can be defined for each field.
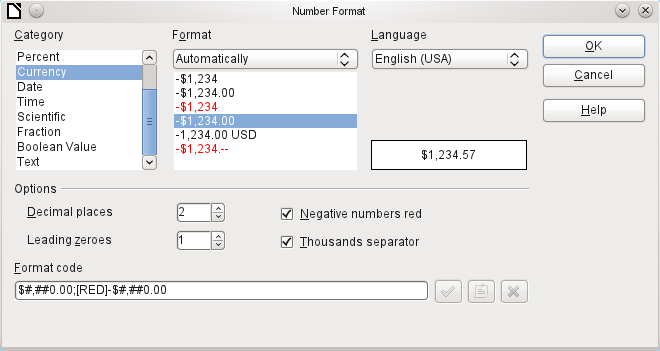
The other entries deal with the internal content of the field in question. This covers the font (for font color, font weight, and so on, see Figure 4), the alignment of the text within the field, and formatting with the corresponding Character dialog (see Figure 5).
Figure 4: Fonts: Character Settings
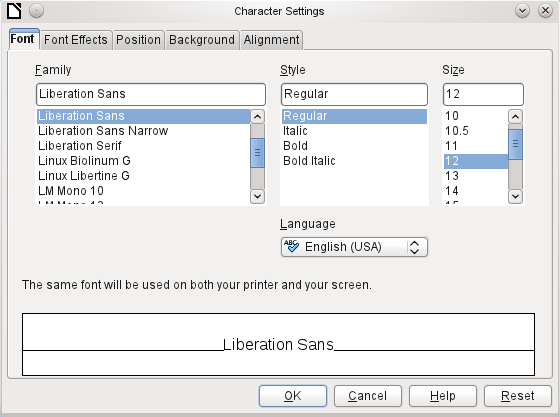
Figure 5: Formatting numbers
A graphical control can contain graphics from both inside and outside the database. Unfortunately it is not possible at present to store a graphic such as a logo permanently in Base. Therefore it is essential that the graphic is available in the search path, even when you are presented with the choice of embedding rather than linking images and the first field Set up as link can be set (literally closed) to a corresponding planned functionality. This is one of several functions that are planned for Base and are in the GUI but have not actually been implemented yet—so the buttons and checkboxes have no effect.
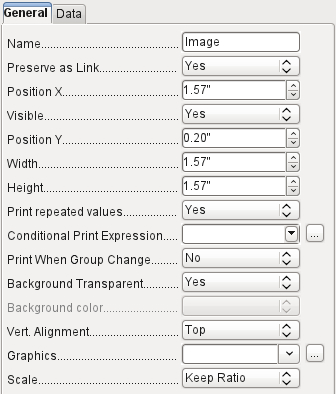
Alternatively, of course, a graphic can be stored in the database itself and so becomes available internally. But in that case, it must be accessible through one of the fields in the query underlying the report.
To take up an external graphic, use the selection button beside the Graphic field to load it. To load a graphical database field, specify the field under the Data tab.
The vertical alignment setting does not seem to have any effect during the design stage. When you call up the report, however, the graphic appears in the correct position.
When scaling, you can select No, Keep aspect ratio, or Autom. Size. This corresponds to the settings for a form:
No: The image is not fitted to the control. If it is too large, a cropped version is shown. The original image is not affected by this.
Keep aspect ratio: The image is fitted to the control but not distorted.
Automatic size: The image is fitted to the control and in some cases may be distorted.
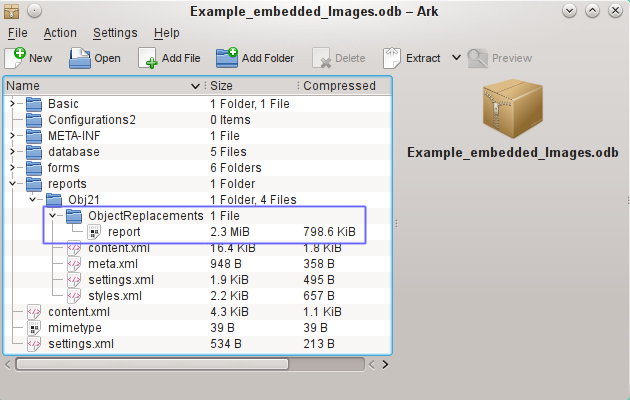
When reports containing images are edited, it can happen that the database becomes significantly larger. Inside the *.odb file, Base places in the report directory an ObjectReplacements folder, for reasons that are not fully understood. This folder contains a “report” file that is responsible for the enlargement.
If the database is opened in an archiving program, this folder with its content is visible in the reports subdirectory. You can safely use the archiving program to find and delete the folder.
Note
If reports are not going to be repeatedly edited, deleting the ObjectReplacements folder once is good enough. The size of this folder can grow very rapidly. This depends on the number and size of the included files. A test showed that a single 2.8MB jpg file enlarged the *.odb file by 11MB! See Bug 80320.
You can insert charts into a report by using the corresponding control or with Insert > Report controls > Chart. A chart is the only way to reproduce data that is not found in the data source specified for the report. A chart can therefore be seen as a kind of subreport, but also as a free-standing component of the report.
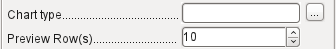
You must draw the place for the chart using the mouse. In the general properties, in addition to the familiar fields, you can choose a Chart type (see the corresponding types in Calc). In addition, you can set a maximum number of records for the preview, which will give an impression of how the chart will finally look.
Charts can be formatted in the same way as in Calc (double-click on the chart). For further information, see the description in the LibreOffice Calc Guide.
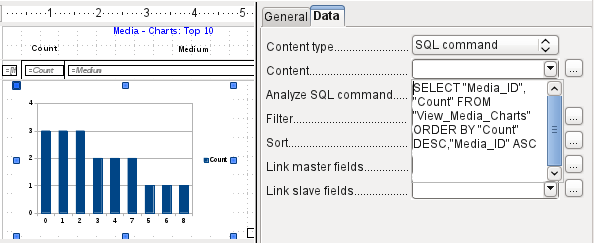
The chart is linked in the Data section with the necessary data fields. Here, in a Media Top 10 list example, the chart shows the frequency with which particular media are borrowed. The Query Editor is used to create a suitable SQL command, as you would do for a listbox in a form. The first column in the query will be used to provide the labels for the vertical bars in the chart, while the second column yields the total number of loan transactions, shown in the height of the bars.
In the example above, the chart shows very little at first, since only limited test loans were carried out before the SQL command was issued.
In the Data properties of the chart, a Query has been specified. This chart from the database Example_sport.odb shows something special in addition to the basics of creating charts in reports: the preview of the chart shows more columns than was anticipated. This results from the content of the query, which creates additional columns that will not all appear in the chart itself.
A filter and sort with the internal tools of the Report Builder is not necessary, as this has already been done as far as possible within the query.
Tip
Basically you want to remove as many tasks as possible from the creation of your reports. Whatever can be managed early in the process by using queries does not need to be done again during the relatively slow process of creating the report itself.
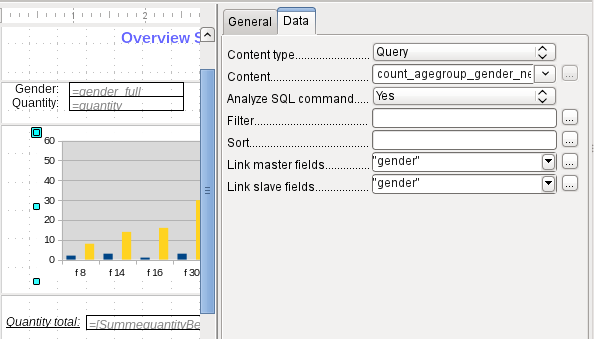
As with main forms and subforms, some fields are now linked together. In the actual report, the age groups for male and female sport camp participants are listed as a table. They are grouped by gender. In each group, there is now a separate chart. To ensure that the chart only uses data for the correct gender, the two fields called “Gender” – in the report and in the chart – are linked together.
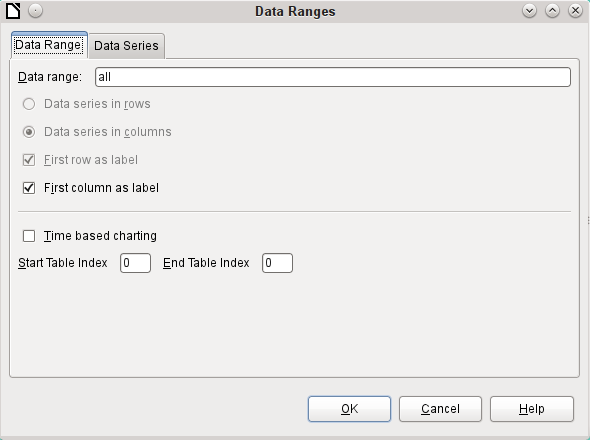
The X-axis of the chart is automatically linked to the first column in the data source table. If there are more than two columns in the table, additional columns are automatically put into the chart. Further settings for the chart can be accessed by selecting the whole chart with a double-click. Clicking the right mouse button opens a context menu above the diagram, its content depending on which element has been selected. It contains possible settings for the data ranges:
Data series in columns is grayed out and therefore cannot be changed. Nor can you change the checkbox First row as label. The remaining settings on the Data Range tab should not be altered, as there are more possibilities here than the Report Builder can actually handle.
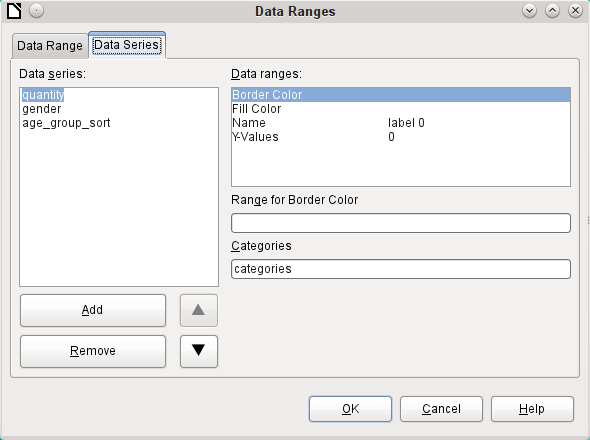
The Data Series tab, on the other hand, hides a couple of settings that can significantly change the default appearance of your chart. It shows all data series that are available for the first column of the query. Any that you do not want to display can be removed at this point.
In the example shown above, there were too many columns visible in the chart. This calls for improvement! Neither gender nor age_group_sort, whose names come from the underlying query, are of any use here. The gender series is used to bind the chart with the data source of the report and cannot in any case be represented numerically. And age_group_sort serves only to ensure a correct sort of the values in the query, since otherwise a code like “m8” would come immediately before “m80” instead of at the beginning (sorting in text fields often leads to similar undesirable results).
When all rows have been removed before the Total row, the preview of the chart looks like this:
This preview shows 10 columns – the first ten columns of the query. In the actual run, only those columns will be displayed that belong to the correct gender: the “m” columns for males and the “f” ones for females.
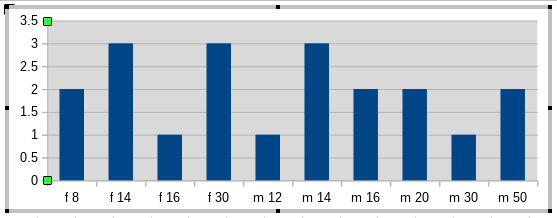
The Y-axis still shows an unfortunate feature. After all, there is no such thing as half a person! Again, this could be improved. However in an automated run with this setting, these numbers will be changed to integers if the range of values does not, as in the above example, stop short at ‘3’. If this automatic processing were to be switched off, then some manual improvement would indeed be necessary.
All further settings are similar to those that Calc uses for chart creation.
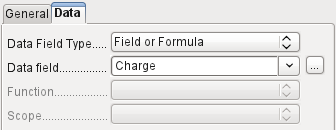
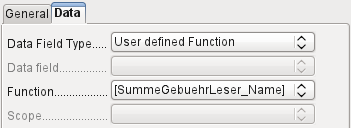
In the properties dialog, the Data tab shows by default only the database field from which the data for this report field will be read. However, in addition to the field types Field and Formula, the types Function, Counter, and User-defined function are available.
You can select in advance the Sum, Minimum, and Maximum functions. They will apply either to the current group or to the whole report. These functions can lead to problems if a field is empty (NULL). In such fields, if they have been formatted as numbers, NaN appears; that is, there is no numerical value present. For empty fields, no calculation is carried out and the result is always 0.
Such fields can be reformatted to display a value of 0 by using the following formula in the Data area of the view.
IF([numericfield];[numericfield];0)
This function calculates with the actual value of a field that has no value. It would seem simpler to formulate the underlying query for the report so that 0 is given instead of NULL for numeric fields.
The Counter counts only the records that will occur either in the group or in the report as a whole. If the counter is inserted into the Details area, each record will be provided with a running number. The numbering will apply only to records in the group or in the whole report.
Finally the detailed User-defined Function is available. It may happen that the Report Builder itself chooses this variant if a calculation has been requested, but for some reason it cannot correctly interpret the data source.
The Report Builder provides a variety of functions, both for displaying data and for setting conditions. If these are not sufficient, user-defined functions can be created using simple calculation steps, which are particularly useful in group footers and summaries.
The Report Builder is based on the Pentaho Report Builder. A small part of its documentation is at http://wiki.pentaho.com/display/Reporting/9.+Report+Designer+Formula+Expressions.
A further source is the Specifications for the OpenFormula Standard:
http://www.oasis-open.org/committees/download.php/16826/openformula-spec-20060221.html
|
Basic principles: |
|
|
Formulas start with an equals sign. |
= |
|
References to data fields are placed in square brackets. |
[Field name] |
|
If the data fields contain special characters (including spaces), the field name must also be enclosed in quotes. |
["This fieldname should be in quotes"] |
|
Text entry must always be in double quotes. |
"Text entry" |
|
The following operators are allowed. |
+, -, |
|
The following relationships are possible. |
= , <> , < , <= , > , >= |
|
Round brackets are allowed. |
( ) |
|
Default error message. |
NA (Not available) |
|
Error message for an empty field that was defined as a number. |
NaN (Perhaps "not a number"?) |
All formula input applies only to the current record. Relationships with previous or following records are therefore not possible.
Next to the date field is a button with three dots whenever a formula can be entered. This button starts the Function Wizard.

However, there are far fewer functions than in Calc. Many functions do have Calc equivalents. There the Wizard calculates the result of the function directly.
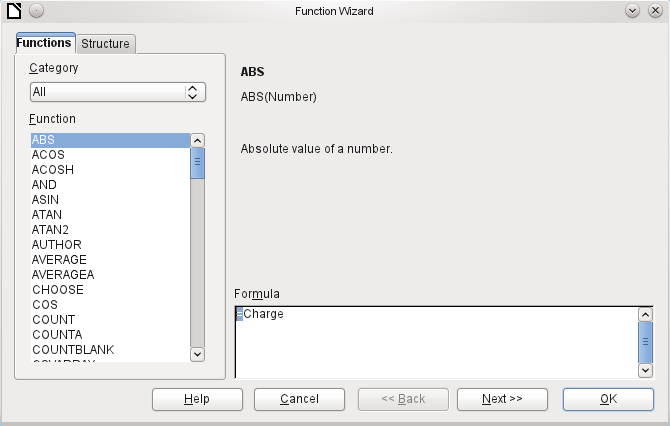
The Function Wizard does not always work perfectly. For instance, text entries are not taken up with double quotes. However, only entries with double quotes are processed when starting the function.
The following functions are available:
|
Function |
Description |
|
Date and Time Functions |
|
|
DATE |
Produces a valid date from numeric values for the year, the month and the day. |
|
DATEDIF |
Returns the total years, months, or days between two date values. |
|
DATEVALUE |
Converts an American date entry in text form (quoted) into a date value. The American variant that is produced can then be reformatted. |
|
DAY |
Returns the day of the month for a given date. |
|
DAYS |
Returns the number of days between two dates. |
|
HOUR |
Returns the hours of a given time in 24-hour format. |
|
MINUTE |
Returns the minutes of a date in the internal numeric format |
|
MONTH |
Returns the month for an entered date as a number. |
|
NOW |
Returns the current date and time. |
|
SECOND |
Returns the seconds of a date in the internal numeric format |
|
TIME |
Shows the current time. |
|
TIMEVALUE |
Converts a text entry for a time into a time value for calculations. |
|
TODAY |
Shows the current date. |
|
WEEKDAY |
Returns the day of the week as a number. Day number 1 is Sunday. |
|
YEAR |
Returns the year part of a date entry. |
|
Logical functions |
|
|
AND |
Yields TRUE when all its arguments are TRUE. |
|
FALSE |
Defines the logical value as FALSE. |
|
IF |
If a condition is TRUE, then this value, else another value. |
|
IFNA |
|
|
NOT |
Reverses the logical value of an argument. |
|
OR |
Yields TRUE when one of its conditions is TRUE. |
|
TRUE |
Defines the logical value as TRUE. |
|
XOR |
Yields TRUE when only one of the linked values is TRUE. |
|
Rounding functions |
|
|
INT |
Rounds down to the previous integer. |
|
Mathematical functions |
|
|
ABS |
Returns the absolute (non-negative) value of a number. |
|
ACOS |
Calculates the arccosine of a number. - arguments between -1 and 1. |
|
ACOSH |
Calculates the areacosine (inverse hyperbolic cosine) – argument >= 1. |
|
ASIN |
Calculates the arcsine of a number – argument between -1 and 1. |
|
ATAN |
Calculates the arctangent of a number. |
|
ATAN2 |
Calculates the arctangent of an x-coordinate and a y-coordinate. |
|
AVERAGE |
Gives the average of the entered values. |
|
AVERAGEA |
Gives the average of the entered values. Text is treated as zero. |
|
COS |
Argument is the angle in radians whose cosine is to be calculated. |
|
EVEN |
Rounds a positive number up or a negative number down to the next even integer. |
|
EXP |
Calculates the exponential function (Base 'e'). |
|
LN |
Calculates the natural logarithm of a number. |
|
LibreOfficeG10 |
Calculates the logarithm of a number (Base '10'). |
|
MAX |
Returns the maximum of a series of numbers. |
|
MAXA |
Returns the maximum value in a row. Any text is set to zero. |
|
MIN |
Returns the smallest of a series of values. |
|
MINA |
Returns the minimum value in a row. Any text is set to zero. |
|
MOD |
Returns the remainder for a division when you enter the dividend and divisor. |
|
ODD |
Rounds a positive number up or a negative number down to the next odd integer. |
|
PI |
Gives the value of the number 'π'. |
|
POWER |
Raises the base to the power of the exponent. |
|
SIN |
Calculates the sine of a number. |
|
SQRT |
Calculates the square root of a number. |
|
SUM |
Sums a list of numeric values. |
|
SUMA |
Sums a list of numeric values. Text and Yes/No fields are allowed. Unfortunately this function (still) ends with an error message. |
|
VAR |
Calculates the variance, starting from a sample. |
|
Text functions |
|
|
EXACT |
Shows if two text strings are exactly equal. |
|
FIND |
Gives the offset of a text string within another string. |
|
LEFT |
The specified number of characters of a text string are reproduced starting from the left. |
|
LEN |
Gives the number of characters in a text string. |
|
LOWER |
Converts text to lower case. |
|
MESSAGE |
Formats the value into the given output format. |
|
MID |
The specified number of characters of a text string are reproduced starting from a specified character position. |
|
REPLACE |
Replaces a substring by a different substring. The starting position and the length of the substring to be replaced must be given. |
|
REPT |
Repeats text a specified number of times. |
|
RIGHT |
The specified number of characters of a text string are reproduced starting from the right. |
|
SUBSTITUTE |
Replaces specific parts of a given text string by new text. Additionally you can specify which of several occurrences of the target string are to be replaced. |
|
T |
Returns the text, or an empty text string if the value is not text (for example a number). |
|
TEXT |
Conversion of numbers or times into text. |
|
TRIM |
Removes leading spaces and terminal spaces, and reduces multiple spaces to a single space. |
|
UNICHAR |
Converts a Unicode decimal number into a Unicode character. For example, 196 becomes 'Ä' ('Ä' has the hexadecimal value 00C4, which is 196 in decimals without leading zeros). |
|
UNICODE |
Converts a Unicode character into a Unicode decimal number. |
|
UPPER |
Returns a text string in upper case. |
|
URLENCODE |
Converts a given text into one that conforms to a valid URL. If no particular standard is specified, ISO-8859-1 is followed.. |
|
Information functions |
|
|
CHOOSE |
The first argument is an index, followed by a list of values. The value represented by the index is returned. |
|
COUNT |
Only fields containing a number or a date are counted. |
|
COUNTA |
Includes also fields containing text. Even NULL is counted, along with boolean fields. |
|
COUNTBLANK |
Counts the empty fields in a region. |
|
HASCHANGED |
Checks if the named column has changed. However no information about the column is provided. |
|
INDEX |
Works with regions |
|
ISBLANK |
Tests if the field is NULL (empty). |
|
ISERR |
Returns TRUE if the entry has an error other than NA. |
|
ISERROR |
Like ISERR, except that NA also returns TRUE. |
|
ISEVEN |
Tests if a number is even. |
|
ISLOGICAL |
Tests if this is a Yes/No value. |
|
ISNA |
Tests if the expression is an error of type NA. |
|
ISNONTEXT |
Tests if the value is not text. |
|
ISNUMBER |
Tests if something is numeric. |
|
ISODD |
Tests if a number is an odd number. |
|
ISREF |
Tests if something is a field reference. |
|
ISTEXT |
Tests if the content of the field is text. |
|
NA |
Returns the error code NA. |
|
VALUE |
|
|
User defined |
|
|
CSVARRAY |
Converts CSV text into an array. |
|
CSVTEXT |
Converts an array into CSV text. |
|
NORMALIZEARRAY |
|
|
NULL |
Returns NULL. |
|
PARSEDATE |
Converts text into a date. Uses the SimpleDateFormat. Requires a date in text as described in this date format. Example: PARSEDATE("9.10.2012";"dd.MM.yyyy") yields the internally usable number for the date. |
|
Document information |
|
|
AUTHOR |
Author, as read from the Tools > Options > LibreOffice > User data. This is not therefore the actual author but the current user of the database. |
|
TITLE |
Returns the title of the report. |
You can use user-defined functions to return specific intermediate results for a group of records. In the above example, a function of this sort was used to calculate the fines in the Reader_Name_Footer area.
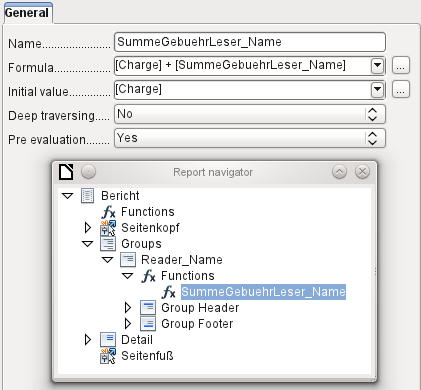
In the Report Navigator the function is displayed under Reader_Name group. By right-clicking on this function, you can define additional functions by name.
The properties of the function SummeGebuehrLeser_Name are shown above. The formula adds the field Charge to the value already stored in the function itself. The initial value is the value of the Charge field on the first traverse of the group. This value is stored in the function under the function name and is reused in the formula, until the loop is ended and the group footer is written.
Deep traversing seems to have no function for now, unless charts are being treated here as subreports.
If Pre evaluation is activated for the function, the result can also be placed in the group header. Otherwise the group header contains only the corresponding value of the first field of the group.
User-defined functions can also reference other user-defined functions. In that case you must ensure that the functions used have already been created. Pre-calculation in functions that refer to other functions must be excluded.
[SumMarksClass] / ([ClassNumber]+1)
Refers to the Class group. The content of the Marks field is summed and the sum for all the records is returned. The sum of the marks is divided by the sum of the records. To get the correct number, 1 must be added as shown with [ClassNumber]. This will then yield the average marks.
Using Data > Data field you can enter formulas that affect only one field in the Details area.
IF([boolean_field];"Yes";"No")
sets the allowable values to "Yes" or "No" instead of TRUE and FALSE.
It can happen that in a field with a formula input, just a single number appears. In text fields this is a zero. To fix this, you must change the text field from the default “Number” to “Text”.
The general properties of group headers, group footers, and fields include a Conditional Print Expression field. Formulas that are written in this field influence the content of a field or the display of an entire region. Here, too, you can make use of the Function Wizard.

[Fieldname]="true"
causes the content of the named field to be displayed only if it is true.
Many forms of conditional display are not fully determined by the specified properties. For instance, if a graphical separator line is to be inserted after the tenth place of a list of competition results, you cannot simply use the following conditional display command for the graphic:
[Place]=10
This command does not work. Instead the graphic will continue to appear in the Details section after each subsequent record. See Bug 73707.
If you just want a rectangular shape overlaid at this location, that can be done using a graphical control, which can be given the address of a (monochrome) graphical file. In the general properties of this control, Scaling > Autom. should be selected. Then the graphic will fit the form and the condition will be fulfilled.
It is safer to bind the conditional display to a group footer rather than to the graphic, if this is not otherwise needed. The line is positioned in the group footer. Then the line does actually appear after the 10th place, when formulated as above. Because the condition is associated with the group footer, the line appears only if it is really needed. Otherwise the conditional display can lead to a blank appearing instead of the line.
Here you can also use the shapes provided by Insert > Shapes > Standard shapes, for example the horizontal line to blend with the group footer.
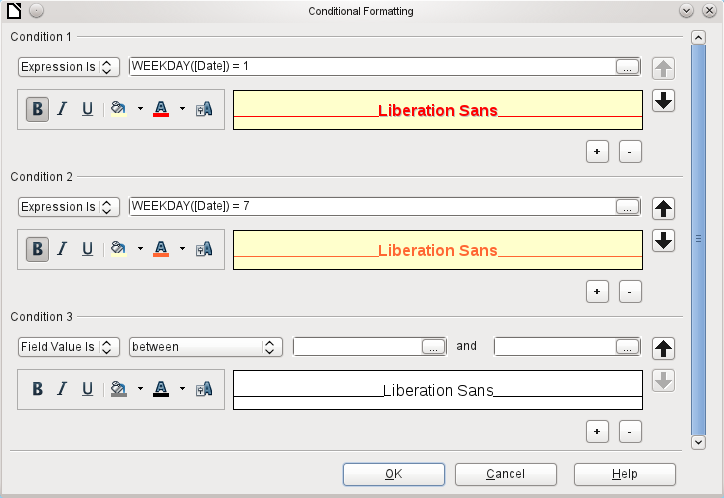
Conditional formatting can be used, for example, to format a calender so that weekends are shown differently. Choose Format > Conditional formatting and enter:
WEEKDAY([Date])=1
and the corresponding formatting for Sundays.
If you use ‘Expression is’ in conditional formatting, you can enter a formula. As is usual in Calc, several conditions can be formulated and are evaluated sequentially. In the above example, first Sunday is tested for, then Saturday. Finally there might be a query about the content of the field. So for example the content ‘Holiday’ would lead to a different format.
Note
If additional uncorrectable errors occur (formulas not implemented, too long text shown as an empty field, and so on), it is sometimes necessary to delete parts of the report or simply create it afresh.
The Report Builder is somewhat treacherous in use, as certain functions are available in theory but don’t work in practice. In addition, LibreOffice Help has very little to say about it. For that reason a few examples are provided here, showing how the Report Builder can be used for various types of report.
To create a bill requires the following considerations:
The individual items must be numbered.
Bills that require more than one page must be given page numbers.
Bills that require more than one page should have a running total on each page, which is carried over to the next page.
Several current bugs seem to make this impossible:
Bug 51452: If a group is set to “Repeat Section”, a page break is inserted automatically before and after the group.
Bug 51453: Groups with individual pagination are allowed for but do not actually work.
Bug 51959: A group footer cannot be repeated. It can only occur at the end of the group, not at the end of each page. And if you choose “Repeat Section”, it disappears completely.
In addition, there are problems with inserting lines into reports. The built-in horizontal and vertical lines only appear in LibreOffice versions 4.0.5 and 4.1.1 respectively. You can use rectangles as a substitute, but they cannot be correctly positioned when there is a page break in the section.
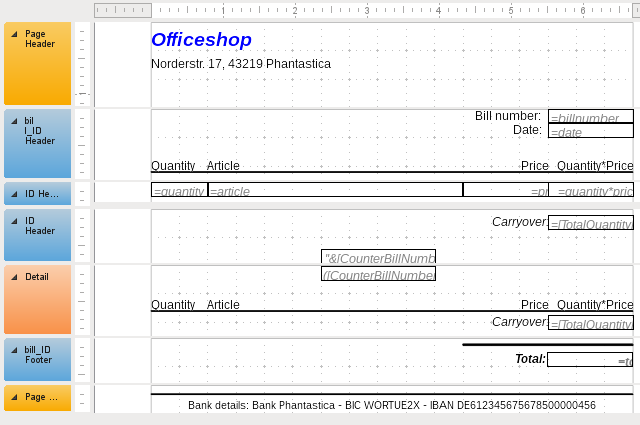
The report in a simple form should look like this:
To overcome the restrictions described above, the creation of the corresponding bill requires exact attention to the page measurements in the final printed document. This example starts out from a DIN-A4 format. The total height of each page is therefore 29.7 cm.
The report needs to be divided into several groups. Two groups relate to the same table field and contain the same table element.
The following table shows the division of the page into the various sections of the report.
|
A |
Top margin |
2.00 cm |
|
B |
Page header (appears on each page, contains no database content, only material such as a company logo or the supplier’s address). |
3.00 cm |
|
C |
Group header for the bill (only items that belong to a bill number should be added later. The group header appears only at the beginning of the bill). |
2.50 cm |
|
D |
Group header for the individual items. (The Detail section is required for a different purpose. Therefore a group comes here that also sorts the contents after input. This group contains only one value.) |
0.70 cm |
|
E |
Group header, also bound to the items. (This section is only displayed if so many items occur that a further page is necessary. It contains the running total and the page number at the bottom of the page. There is a page break after this section,) |
2.00 cm |
|
F |
Details section. (This section is only shown if so many items occur that a further page is needed. It contains the sum carried over, and the page number at the top of the page.) |
2.50 cm |
|
G |
Group footer for the bill number. (Here follows the total sum for the bill, possibly with added VAT. The group footer appears only on the last page of the bill.) |
1.60 cm |
|
H |
Page footer (e.g. bank details) |
1.00 cm |
|
I |
Page margin |
1.00 cm |
A page break follows only if there are too many items. For the items, we have the following free spaces:
|
|
29.70 cm |
(DIN A 4) |
|
- |
2.00 cm |
(Pos. A) |
|
- |
3.00 cm |
(Pos. B) |
|
- |
2.50 cm |
(Pos. C) |
|
- |
1.60 cm |
(Pos. G) |
|
- |
1.00 cm |
(Pos. H) |
|
- |
1.00 cm |
(Pos. I) |
|
= |
18.60 cm |
|
The remaining free space is therefore at most 18.60 cm/0.70 cm = 26.57. Rounding up gives 26 item lines.
As soon as the 27th item appears, a page break must immediately follow. This indicates that the group header E and the Details section must be displayed. So we need a counter for the items (section C). When this counter hits 27, the Details section (F) is displayed.
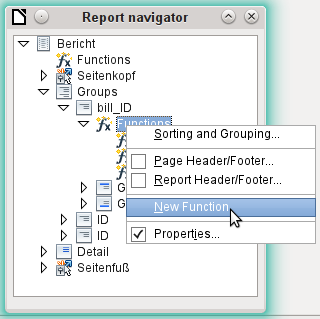
The counter for the items is defined as follows:
Using the Report Navigator, we look for the Bill_ID group. Our new function is called CounterBillNumber. The formula is [CounterBillNumber] + 1. The initial value is 1. No subreports are bound in (there is no such function). Nor is it calculated in advance. For advance calculations we use a separate counter, CounterTotal.
The group heading E and the Details section F are both displayed if a total of more than 26 items are in the bill and the current record position has reached 26. The expression for the conditional display is therefore the same for both:
AND([CounterBillNumber]=26;[CounterTotal]>26)
The content of this section therefore appears only if at least 27 items are expected. Group header E appears on the first page. A page break follows, and the content of the Details section appears on the next page.
Now we must calculate the number of sections that must appear on the first page.
|
|
29.70 cm |
(DIN A 4) |
|
- |
2.00 cm |
(Pos. A) |
|
- |
3.00 cm |
(Pos. B) |
|
- |
2.50 cm |
(Pos. C) |
|
- |
18.20 cm |
(Pos. D * 26) |
|
- |
1.00 cm |
(Pos. H) |
|
- |
1.00 cm |
(Pos. I) |
|
= |
2.00 cm |
|
The group footer is not required for the first page. There are 26 item lines in total. The group header E can therefore occupy at most 2 cm on the first page. These 2 cm must accommodate the running total and the page number. To ensure a correct page break in all circumstances, this section should actually be a bit smaller than 2 cm. In the example, we use 1.90 cm.
The Details section comes at the top of the next page. As the group header for the items (C) does not occur on this page, the Details section can take up as much space as the header did, namely 2.50 cm. Then begin the next lot of items with the same arrangement as on the previous page.
The sum carried over is calculated by simply adding up the previous items.
The Report Navigator is used to find the Bill_number group. The new function to be created will be called TotalPrice. The formula is [Price] + [TotalPrice]. The initial value is [Price]. No subreports are bound in. Nor does this figure need to be calculated in advance.
The sum to be carried over is displayed both in the Group header E and in the Details section. In the group header, it is right at the top of the page. On the first page it appears at the bottom. In the Details section, the sum is right at the bottom. It appears on page 2 directly below the table header.
The query to determine the page number is similar to the one for determining the display of the group header and the details section:
IF([CounterBillNumber]=26;"Page 1";"")
This gives the page number for the first page. Further IF-queries can be used for the other pages.
The page number for the following page is easily set to “Page 2” in the same way.
If the formulas are continued in the same way, they can cover as many pages as you like.
The expression for conditional display changes from
AND([CounterBillNumber]=26;[CounterBillComplete]>26)
to
AND(MOD([CounterBillNumber];26)=0;[CounterBillComplete]>[CounterBillNumber])
The group header E and the Details section F appear only when dividing the item counter by 26 gives no remainder and the total number of items is greater than the item counter.
The expression for the page number changes from
IF([CounterBillNumber]=26;"Page 1";"")
to
"Pag "&[CounterBillNumber]/26
for the current page and
"Page "&([CounterBillNumber]/26)+1
for the following page.
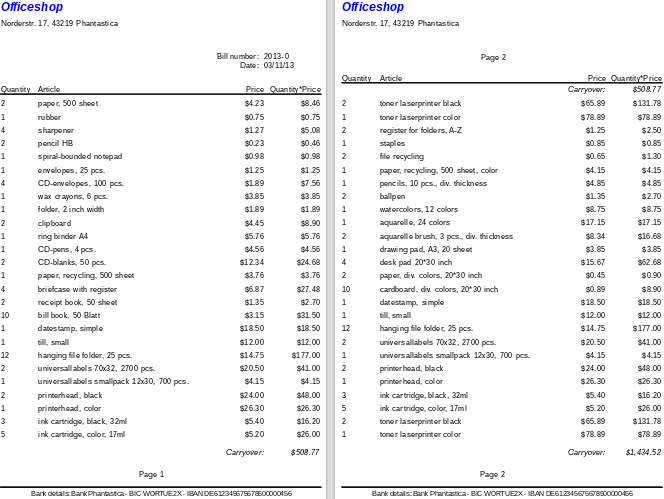
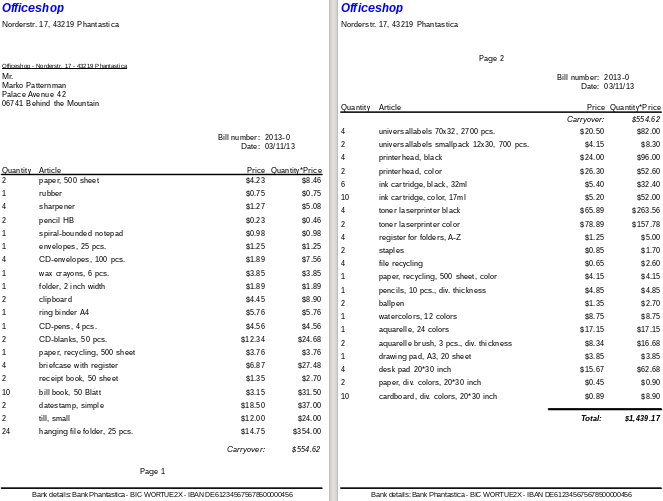
The following report printout using these settings is still not quite ready for use:
Because of the address field, there are fewer items on the first page of the bill than on the second page. The Details section right at the top of the second page is therefore significantly smaller than the group header for the bill (C).
To allow for different numbers of items on the first two pages, the formulas must be adjusted.
The following calculation ensures that the corresponding sections are correctly displayed.
AND(MOD([CounterBillNumber]-20;24)=0;[CounterBillComplete]>[CounterBillNumber])
We subtract the number of items on the first page from the item counter. This difference is divided by the possible total number of items on the second page. If the division is exact with no remainder, the first condition for the display of the group header E and the Details section F has been fulfilled. In addition, as previously shown, the current value of the item counter must be less than than the expected total. Otherwise there would be room for the calculated total sum on the current page.
The possible total number of items on the second page is now smaller because this page now contains the bill number and the date.
The page number can now be calculated more simply:
"Page "&INT([CounterBillNumber]/24)+1
The INT function rounds down to the nearest integer. The first page contains a maximum of 20 items. The division therefore gives a result of <1 for this first page. This rounds down to zero. So we need to add 1 to the calculated page number so that 1 appears on the first page. Similarly for page 2.
The report still shows an aesthetic fault. A careful look at the bill items shows that the three bottom items on the pages are the same. This is because records have simply been copied. They are not actually the same records, but different ones for the same product which have been processed independently of one another. It would be better here to group by product type so that each product appears only once with the total number ordered.
Basically you should try to remove as many calculations and groupings as possible from the Report Builder. Instead of using the Report Builder’s groups, it is better to use the grouping functions in the query editor. In order for the Report Builder to process the query easily, turn it into a view. Otherwise the Report Builder will try to improve the query with its own grouping and sorting functions, which can rapidly lead to quite impractical coding.
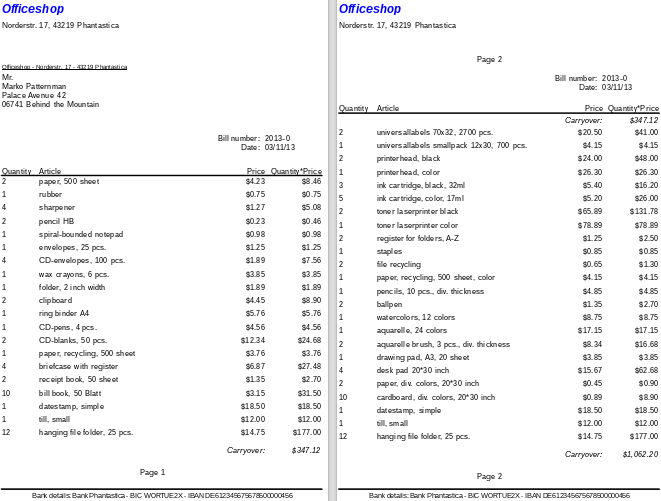
The final result is as follows:
Here all the items occur only once. The original 12 hanging folders at the bottom of page 1 are now 24 hanging folders. Quantity*Price has been recalculated accordingly.
Especially in the kind of bill production shown in the previous example, it can be useful to prepare and preview a new print after each entry of an item. The content of the bill should be determined usIng a form, and the printing of the individual documents should follow.
Reports cannot be launched with a filter by using macros. However the query which is used to make the report can be filtered beforehand. This is done either by a parameterized query using the form
SELECT * FROM "bill" WHERE "ID" = :ID
or by a query that is supplied with data using a one-line filter table:
SELECT * FROM "bill" WHERE "ID" = (SELECT "Integer" FROM "Filter" WHERE "ID" = TRUE)
In a parametered query, the content must be inserted into the corresponding dialog field after launching it.
When a filter table is used to control the process, its content to be written by a macro. Therefore a separate entry is no longer necessary, which makes life easier for the user. The process is described below.
The filter table should contain only one record at a time. This means that its primary key can be a Yes/No field. Other fields in the table are named in such a way that it is clear what type of content they hold. In the example, the field that is to filter the primary key of the Bill table is called Integer, as the key itself is of this type. For other filtering possibilities, other fields can be added later. The Integer filter can be used at different times for several different tables, since the old content is always overwritten with new before printing. But this multiple use only works in a single-user database (Base with internal HSQLDB). In a multi-user database, there is always the possibility that some other user will change the filter value in one of the normal tables while the query that uses the filter is being carried out,
|
Fieldname |
Fieldtyp |
|
ID |
Yes/No [BOOLEAN] |
|
Integer |
Integer [INTEGER] |
This table is filled at the start with one record. For this purpose, the ID field must be set to have the value Yes (“TRUE” in SQL).
To call up a single report, the form must contain somewhere the primary key of the Bill table. This primary key is read and transferred to the filter table by a macro. Then the macro launches the desired report.
SUB Filter_and_Print
DIM oDoc AS OBJECT
DIM oDrawpage AS OBJECT
DIM oForm AS OBJECT
DIM oField AS OBJECT
DIM oDatasorce AS OBJECT
DIM oConnection AS OBJECT
DIM oSQL_Command AS OBJECT
DIM stSQL AS STRING
oDoc = thisComponent
oDrawpage = oDoc.Drawpage
oForm = oDrawpage.Forms.getByName("MainForm")
oField = oForm.getByName("fmtID")
oDatasource = ThisComponent.Parent.CurrentController
If NOT (oDatasorce.isConnected()) THEN
oDatasource.connect()
END IF
oConnection = oDatasource.ActiveConnection()
oSQL_Command = oConnection.createStatement()
stSql = "UPDATE ""Filter"" SET ""Integer"" = '"+oField.GetCurrentValue()+"' WHERE
""ID"" = TRUE"
oSQL_Command.executeUpdate(stSql)
ThisDatabaseDocument.ReportDocuments.getByName("bill").open
END SUB
In this example, the form is called MainForm. The primary key is called fmtID. This key field does not have to be visible in order for the macro to access it. The value of the field is read out and the UPDATE command writes it into the table. Then the report is launched. The view to which the report refers is expanded into a condition:
… WHERE "bill_ID" = IFNULL((SELECT "Integer" FROM "Filter" WHERE "ID" = TRUE),"bill_ID") …
The Integer field is read out. If it has no value, it is set to bill_ID. This means that all records are displayed, not just the filter record. So from the same view, all the stored records can be printed.
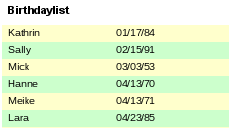
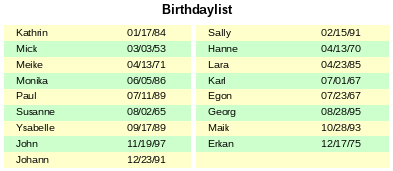
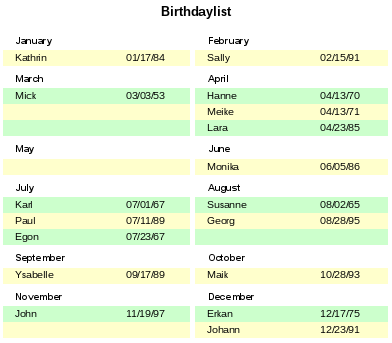
When you are reading individual lines in a table within a report, it is easy for to the eye to slip up or down a line. Coloring in the background of at least one line helps to prevent this. In the following example, the lines are simply colored alternately. The result looks like this:
The basis of the report is a query with names and dates. The original table is queried with sorting by date (month and day) to show the sequence of birthdays through the year. This is done by:
... ORDER BY MONTH("birthday") ASC, DAY("birthday") ASC
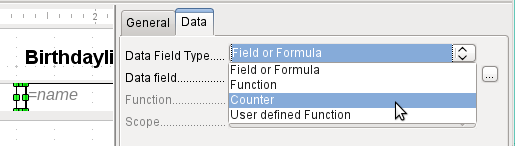
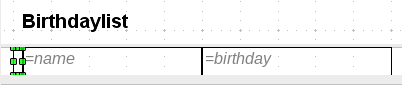
To get the alternating colors, we need to create a function which can later use some value to set conditions, that in turn determine the background color. We create a text field in the report and, using Properties > Data > Data Field Type, we define a counter.
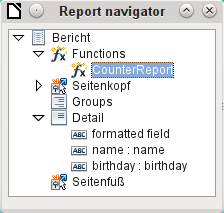
We need the name of the function for the conditional formatting. The actual counter does not need to appear in the expression. The name can be read directly from the field. If the field is deleted again, the function name is accessible using View > Report Navigator.
Now the counter must be used to give each text field its own format. The condition is an expression that is not directly connected to the field. Therefore it is set up as Condition 1 > Expression is > MOD([CounterReport];2)>0. MOD calculates the remainder from a division. For all odd numbers, this is greater than 0; for even numbers it is 0 precisely. Lines 1, 3 and 5 will therefore be assigned this format.
The second condition is formulated as the exact opposite and a corresponding format assigned. Actually this second condition could be omitted and a default format set in the properties of each field. The conditional format specified in the first condition would then replace this default whenever the condition was satisfied.
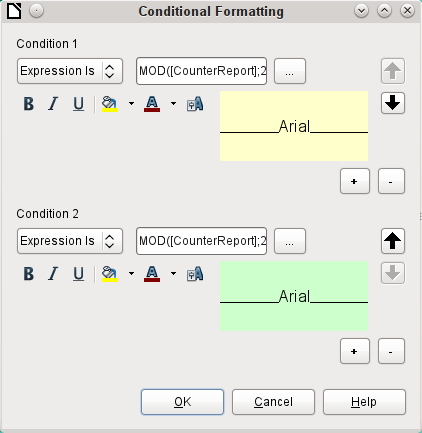
As the conditional format overwrites all default formatting, a text alignment for this format must be included using the character settings.
Here the letters are to be vertically centered on the colored text field. The horizontal alignment is the standard one, but an indent needs to be added, so that the letters are not crowded together at the left side of the text field.
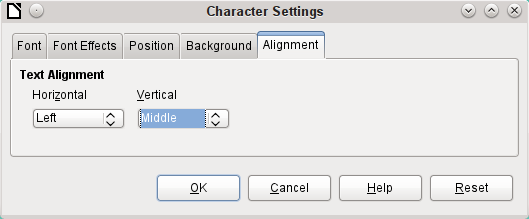
Experiments with adding spaces to the content of a query or formula have not led to proper indentation of the text. The leading spaces are simply cut out.
A more successful method is to position a text field before the actual text but without binding it to a data field. This text field is conditionally formatted in the same way as the others, so that a consistent visible indentation appears on printing.
With clever query techniques, you can make a report with multiple columns such that the horizontal sequence corresponds to successive records:
The first record goes into the left column, the second into the right. Records are sorted according to the sequence of birthdays within the year.
Sorting by birthday makes the query for this report rather long. If the sort was by the primary key of the underlying table, it would be a lot shorter. The sort criterion uses a recurrent text block that is explained further below.
Here is the query that underlies the report:
SELECT "T1"."name" "name1", "T1"."birthday" "birthday1", "T2"."name" "name2", "T2"."birthday" "birthday2"
FROM
( SELECT "name", "birthday", "rowsNr" AS "row" FROM
( SELECT "a".*,
( SELECT COUNT( "ID" ) FROM "birthdays" WHERE
RIGHT( '0' || MONTH( "birthday" ), 2 ) ||
RIGHT( '0' || DAY( "birthday" ), 2 ) || "ID"
<= RIGHT( '0' || MONTH( "a"."birthday" ), 2 ) ||
RIGHT( '0' || DAY( "a"."birthday" ), 2 ) || "a"."ID" )
AS "rowsNr" FROM "birthdays" AS "a" )
WHERE MOD( "rowsNr", 2 ) > 0 )
AS "T1"
LEFT JOIN
( SELECT "name", "birthday", "rowsNr" - 1 AS "row" FROM
( SELECT "a".*,
( SELECT COUNT( "ID" ) FROM "birthdays" WHERE
RIGHT( '0' || MONTH( "birthday" ), 2 ) ||
RIGHT( '0' || DAY( "birthday" ), 2 ) || "ID"
<= RIGHT( '0' || MONTH( "a"."birthday" ), 2 ) ||
RIGHT( '0' || DAY( "a"."birthday" ), 2 ) || "a"."ID" )
AS "rowsNr"
FROM "birthdays" AS "a" )
WHERE MOD( "rowsNr", 2 ) = 0 )
AS "T2"
ON "T1"."row" = "T2"."row"
ORDER BY "T1"."row"
There are two identical subqueries in this query. The first two columns relate to the subquery with the alias T1 and the last two to the subquery T2.
The subqueries provide another field (rowsNr) in addition to those in the Birthdays table, which makes it possible to distinguish lines and to sort the records. The main query uses this together with the line numbering facility in queries (see Chapter 5, Queries).
RIGHT( '0' || MONTH( "birthday" ), 2 ) || RIGHT( '0' || DAY( "birthday" ), 2 ) || "ID"
This formula allows a unique sequence of records to be established. As the example records are to be sorted by date, it would be easy to think that only the date should be used in the comparison. It is more difficult in practice because it is not the birth dates themselves but their sequence within a single year that counts. Additional problems are caused by identical date values which prevent a unique sequence from being established. Hence sorting is not only by month and day but, within that, by the unique primary key. And to prevent month 10 from coming before month 2, a leading zero is placed before each month using | | when the sort criterion is put together; if the month already has 2 digits, this is subsequently removed using RIGHT( … , 2 ).
SELECT COUNT( "ID" ) gives the number of records whose combination of month, day and primary key is less than or equal to that for the current record in the Birthdays table. Here we have a correlating subquery (see chapter on “Queries”).
MOD( "rowsNr", 2 ) determines if this number is odd or even. MOD gives the remainder from a division, in the example, division by 2. This causes the rowsNr to give the values ‘1’ and ‘0’ alternately. This in turn distinguishes the queries for T1 and T2.
In the next query level of T2, Row is defined as "rowsNr"–1. In this way T1 and T2 are directly comparable.
T1 is linked to T2 using LEFT JOIN, so that all the dates in the Birthdays table are shown for odd record numbers too. When T1 and T2 are combined, direct reference can now be made to the actual rows: "T1"."row" = "T2"."row".
Finally the whole content is sorted on the value of row, which is the same for T1 and T2. The report can also use this directly using its grouping function.
It is much more complicated to create query techniques for making subdivisions in addition to the 2-column format. In such cases, empty lines occur in the middle of the report, whereas in the previous 2-column example, they occur only at the end. The Report Builder does not work well with this sort of query. Therefore instead of this, we will use two linked views.
First we create the following view:
SELECT "a"."ID", "a"."name", "a"."birthday",
MONTH( "a"."birthday" ) AS "monthnumber",
( SELECT COUNT( "ID" ) FROM "birthdays"
WHERE MONTH( "birthday" ) = MONTH( "a"."birthday" )
AND RIGHT( '0' || DAY( "birthday" ), 2 ) || "ID" <=
RIGHT( '0' || DAY( "a"."birthday" ), 2 ) || "a"."ID" )
AS "monthcounter"
FROM "birthdays" AS "a"
All fields of the Birthdays table are included. In addition, the month is included as a number. The Birthdays table is given the alias “a”, so that the table can be accessed with a correlating subquery.
The subquery counts all records within a month whose date values have a smaller or equal day number. For identical dates, the primary key determines which comes first. This technique is the same as in the previous example.
The report_month_two_columns view accesses the monthnumber view. Only extracts of this view are given here:
SELECT
"Tab1"."name" AS "name1",
"Tab1"."birthday" AS "birthday1",
1 AS "monthnumber1",
IFNULL("Tab1"."monthcounter",999) AS "monthcounter1",
'January' AS "month1",
"Tab2"."name" AS "name2",
"Tab2"."birthday" AS "birthday2",
2 AS "monthnumber2",
IFNULL("Tab2"."monthcounter",999) AS "monthcounter2",
'February' AS "month2"
FROM
(SELECT * FROM "monthnumber" WHERE "monthnumber" = 1) AS "Tab1"
RIGHT JOIN (SELECT * FROM "monthnumber" WHERE "monthnumber" = 2) AS
"Tab2" ON "Tab1"."monthcounter" = "Tab2"."monthcounter"
UNION
SELECT "Tab1"."name" AS "name1",
"Tab1"."birthday" AS "birthday1",
1 AS "monthnumber1",
IFNULL("Tab1"."monthcounter",999) AS "monthcounter1",
'January' AS "month1",
"Tab2"."name" AS "name2",
"Tab2"."birthday" AS "birthday2",
2 AS "monthnumber2",
IFNULL("Tab2"."monthcounter",999) AS "monthcounter2",
'February' AS "month2"
FROM
(SELECT * FROM "monthnumber" WHERE "monthnumber" = 1) AS "Tab1"
LEFT JOIN (SELECT * FROM "monthnumber" WHERE "monthnumber" = 2) AS
"Tab2" ON "Tab1"."monthcounter" = "Tab2"."monthcounter"
UNION
...
ORDER BY "monthnumber1", "monthcounter1", "monthcounter2"
First the subquery reads from monthnumber all dates for which monthnumber = 1. This selection is given the alias Tab1 . At the same time, all dates for monthnumber = 2 are read into Tab2. These tables are linked with a RIGHT JOIN,so that all records from Tab2 are displayed but only those records from Tab1 with the same monthcounter as Tab2.
The columns of the view must have different names so that each column is provided with an alias. Also a 1 is entered directly as the monthnumber for Tab1 and January as the month1. These entries also appear when there is no record from Tab1 but still some records in Tab2. If there is no monthcounter available, the value 999 is entered. As Tab1 is linked to Tab2 by a RIGHT JOIN, it may happen that when there are fewer records in Tab1, empty fields are shown instead. Since the sorting later on would put such records ahead of all records with content, a very high number is entered instead.
The creation of columns for Tab2 is similar. Here though it is not necessary to use the code IFNULL("Tab2"."monthcounter",999), since, with a RIGHT JOIN for Tab2, all rows from Tab2 will be displayed, but it will no longer be the case that more rows could be created from Tab1 than from Tab2.
Precisely this problem is solved by the linking of two queries. Using UNION, all records from the first query and all records from the second query are displayed. The records from the second query appear only if they are not identical with a previous record. This means that UNION works like DISTINCT.
Using UNION, the same query is asked again, only Tab1 and Tab2 are now linked with a LEFT JOIN. This causes all records from Tab1 to be displayed even if Tab2 contains fewer records than Tab1.
For months 3 and 4, 5 and 6, and so on, exactly equivalent queries are used and again attached to the previous query using a UNION.
Finally the result of the view is sorted by monthnumber1, monthcounter1, and monthcounter2. There is no need to sort by monthnumber2, because monthnumber1 already gives the same record sequence.
The Report Builder sometimes hides errors whose exact cause cannot easily be determined afterwards. Here are a few sources of error and useful counter-measures.
A database is set up to simulate the sale of stock. A query calculates a total price from the number of items bought and the unit price.
SELECT "sales"."sum", "stock"."stock", "stock"."Price", "sales"."sum"*"stock"."Price" FROM "sales", "stock"
WHERE "sales"."stock_ID" = "stock"."ID"
This query serves as the basis of the report. If however the field "sales"."sum"*"stock"."Price" is called up in the report, it remains empty. If on the other hand it is provided with an alias in the query, the Report Builder can easily access it:
SELECT "sales"."sum", "stock"."stock", "stock"."Price", "sales"."sum"*"stock"."Price" AS "TPrice"
FROM "sales", "stock" WHERE "sales"."stock_ID" = "stock"."ID"
The field now accesses "Tprice" and presents the corresponding value.
Sometimes a report can be prepared but then not produced or even saved. A rather uninformative error message appears:
“Report could not be produced. An exception of type com.sun.star.lang.WrappedTargetExeption was discovered”
Here it can be helpful to read the additional information attached to the message. If you see there a reference to SQL, it means that the Report Builder cannot interpret correctly the SQL code in the data source.
It may help here to use the Report Navigator to set Data > Analyze SQL command > No. Unfortunately this solution causes existing groups to stop functioning.
A better way is to use a view rather than a query as the basis for your report. This is set up in such a way that it looks like a table to the Report Builder and can be edited without any difficulty. Even the sorting requirements of the view function smoothly.