Copyright
This document is Copyright © 2026 by the LibreOffice Documentation Team. Contributors are listed below. This document may be distributed and/or modified under the terms of either the GNU General Public License (https://www.gnu.org/licenses/gpl.html), version 3 or later, or the Creative Commons Attribution License (https://creativecommons.org/licenses/by/4.0/), version 4.0 or later. All trademarks within this guide belong to their legitimate owners.
Contributors
Contributors for this edition:
Peter Schofield
Contributors for previous editions:
Claire Wood, Dave Barton, Elzett Kotze, Jean Hollis Weber, John A Smith, Kees Kriek, Martin Fox, Peter Schofield
Feedback
Please direct any comments or suggestions about this document to the Documentation Team Forum at https://community.documentfoundation.org/c/documentation/loguides/ (registration is required) or send an email to: loguides@community.documentfoundation.org.
-
Note
Everything sent to a forum, including email addresses and any other personal information that is written in the message, is publicly archived and cannot be deleted. Emails sent to the forum are moderated.
Publication date and software version
Published April 2026. Based on LibreOffice 26.2.
Other versions of LibreOffice may differ in appearance and functionality.
Introduction
This chapter explains tools and functions used for modifying existing drawings, and for creating or editing a selected object or a group of selected objects. When several objects are selected, a selection frame around the objects corresponds to the smallest rectangle containing all objects. This selection frame is also called a selection rectangle, or marquee. Selection handles appear on this rectangular frame which is also large enough to contain all objects when that have been selected.
-
Note
The color and shape of selection handles changes depending on the selected tool and function when changing object properties. Also, the color of selection handles depends on computer operating system and computer set up.
Selecting objects
Direct selection
Direct clicking on an object is the easiest selection method. For objects not filled, click on the object border to select it. To select more than one object, hold the Shift key down while clicking on objects. To deselect an object, move the cursor into a blank space and click.
Selection by framing
Click and drag the cursor around several objects to create a selection rectangle around several objects. Only objects that are within this selection rectangle are selected. Make sure Select on the Drawing toolbar (Figure 1) is active when selecting multiple objects.
Selecting hidden objects
Objects located behind other objects and not visible can also be selected. When a hidden object is selected, its selection handles appear through the objects covering the selected object.
-
Windows, Mac or Linux — press the Tab key to select and cycle through objects in a drawing, stopping at the hidden object to select it. To cycle through objects in reverse order, press Shift+Tab.
-
Windows or Mac only — select an object in front of a hidden object, then press the Alt key (macOS ⌥) and click to select the hidden object. If there are several hidden objects, keep holding down the Alt key (macOS ⌥) and click until the required object is reached. To cycle through objects in reverse order, hold down the Alt+Shift keys (macOS ⌥+Shift) and click.
Figure 1: Drawing toolbar
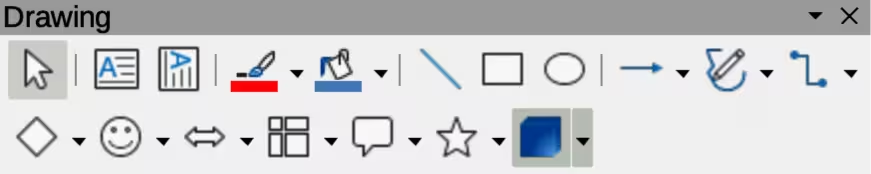
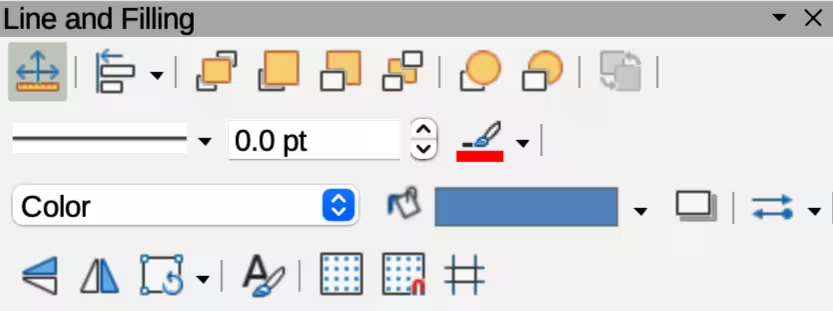
Figure 2: Line and Filling toolbar
Arranging objects
In complex drawings, several objects can be stacked on top of one another. Use one of the following methods to rearrange the stacking order by moving an object forward or backward:
-
Select an object, go to Shape > Arrange on the Menu bar, or right-click on the object and select Arrange from the drop down menu, then use one of the following options:
-
Bring to Front (Ctrl+Shift++) (macOS ⌘+Shift++)
-
Bring Forward (Ctrl++) (macOS ⌘++)
-
Send Backward (Ctrl+–) (macOS ⌘+–)
-
Send to Back (Ctrl+Shift+–) (macOS ⌘+Shift+–)
-
In Front of Object
-
Behind Object
-
Select an object, then select one of the Arrange tools at the left end of the Line and Filling toolbar (Figure 2). When the cursor hovers over a tool, its function is indicated.
Positioning and adjusting objects
Zoom
For positioning and adjustment of objects, Draw has a zoom function that reduces or enlarges the display of the current drawing. For example, zoom in to position objects on a drawing with greater accuracy, or zoom out to see the complete drawing. Zooming is controlled using the Status Bar, Zoom & View Layout dialog, or Zoom toolbar.
-
Note
The zoom function is handled differently in a Linux operating system. Drawings saved with 100% zoom setting in Windows or macOS are displayed at a larger zoom setting than in a Linux operating system.
Status bar
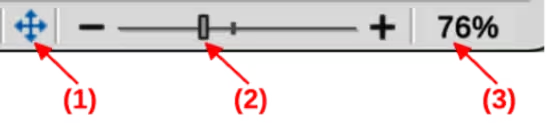
The zoom controls are located on the right side of the Status Bar (Figure 3) for easy access when zooming. Use one of the following methods to change the zoom factor:
-
Use Fit page to current window to fit the drawing to the open window.
-
Move the Zoom slide control toward the minus sign (–) on the zoom slide control to reduce the zoom factor.
Figure 3: Status Bar zoom controls
|
|
|
Figure 4: Zoom & View Layout dialog
-
Move the Zoom slide control toward plus sign (+) on the zoom slide control to increase the zoom factor.
-
Right-click on the Zoom percentage number and select a zoom option from the context menu that opens.
Zoom & View Layout dialog
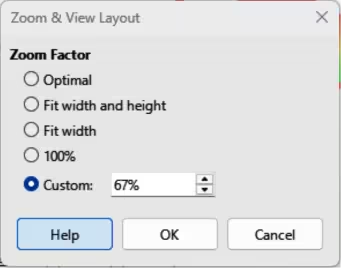
Open the Zoom & View Layout dialog (Figure 4) using one of the following methods:
-
Click on the zoom percentage number in the Status Bar.
-
Go to View > Zoom > Zoom on the Menu bar.
Options in the Zoom & View layout dialog control how a drawing is displayed.
Zoom Factor
Optimal
Resizes the display to fit the text width in the document.
Fit width and height
Displays the entire page on the screen.
Fit width
Displays the complete document page width. The top and bottom page edges may not be visible.
100%
Displays the document at its actual size.
Custom
Enter a percentage in the box for the zoom factor to display the document, or use the minus (–) or plus (+) signs to change the zoom factor.
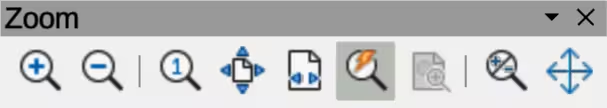
Figure 5: Zoom toolbar
Zoom toolbar
Go to View > Toolbars > Zoom on the Menu bar to open the Zoom toolbar (Figure 5). The tools available, from left to right, are as follows:
Zoom In
Zoom Out
100%
Zoom Previous
Zoom Next
Entire Page
Page Width
Optimal
Object Zoom
Zoom & Pan
Shift
Moving and adjusting object size
When moving an object or changing its size, check the left corner of the Status Bar at the bottom of the Workspace (Figure 6). From left to right, this area shows a shape is selected, its position on the drawing in X/Y coordinates and object dimensions. The measurement units are selected in Tools > Options > LibreOffice Draw > General (macOS Preferences > LibreOffice > LibreOffice Draw > General).
Moving objects
To move an object (or a group of objects), select it, then click within the object borders and drag the object. During movement, a ghost object image appears to help with repositioning, as shown by the example in Figure 7. When the object reaches its new location, release the object.
Figure 6: Example of left end of Status Bar with shape selected
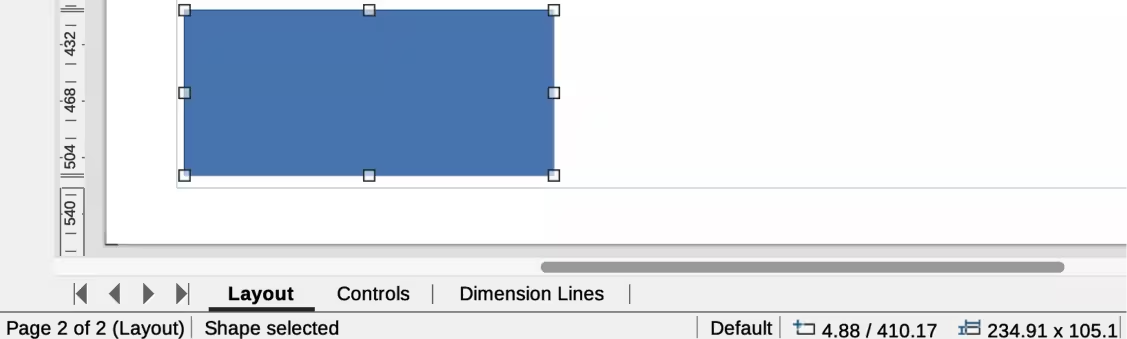
Figure 7: Example of moving selected objects
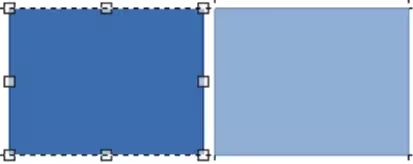
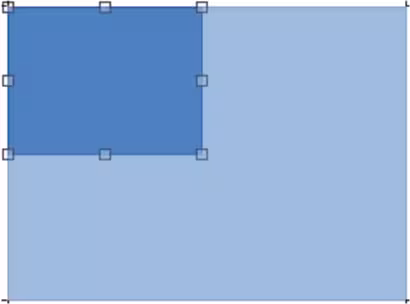
Figure 8: Example of adjusting object size
Adjusting object size
To change the size of a selected object (or a group of selected objects), move the cursor to a selection handle. The cursor changes shape to indicate the direction of movement for that selection handle. Click on the selection handle and drag it to change object size. The results depend on which selection handle is used, as follows:
-
To resize an object in one axis, use a side, top, or bottom handle.
-
To resize using both axes, use a corner handle.
As an object size changes, a ghosted object outline appears, as shown by the example in Figure 8. When the required object size is reached, release the object.
-
Note
Pressing and holding the Shift key when resizing an object changes the size to maintain the aspect ratio between width and height. This Shift key behavior works on all selection handles.
Figure 9: Example of modifying arcs
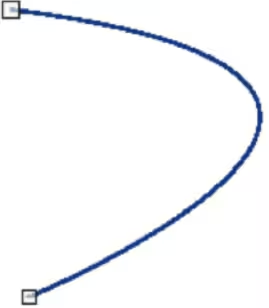
Figure 10: Example of rotation mode
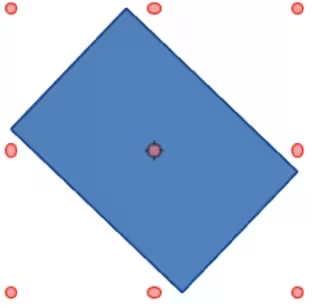
Figure 11: Transformations toolbar
Modifying arcs
The size of an arc is changed by adjusting the positions of the start and end points of an arc. The selection handle at the start point of an arc is larger than the end point of an arc.
-
Select an arc, then right click on the arc and select Points from the drop down menu, or press the F8 key. Two handles appear at the start and end of the arc, as shown by the example in Figure 9.
-
Click and drag on the start or end handle to change the arc shape.
-
Release the selected handle when the required arc shape is achieved.
Rotating and slanting objects
Rotating objects
To rotate an object (or a group of objects), select an object to change rotation mode as follows:
-
Select an object, or a group of objects, so that the selection handles are displayed.
-
Use one of the following methods to switch to rotation mode. The selection handles change shape and color and a center of rotation indicator appears in the object center, as shown by the example in Figure 10.
-
Click again on a selected object, or a group of objects. DO NOT double click. A double click is used to switch an object into text mode.
-
Click on the triangle ▼ on the right of Transformations on the Line and Filling toolbar (Figure 2) and select Rotate from the pop up menu.
-
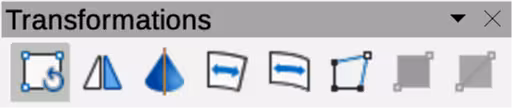
Go to View > Toolbars > Transformations on the Menu bar to open the Transformations toolbar (Figure 11) and select Rotate.
-
Move the cursor over a corner selection handle and the cursor changes shape to indicate rotation mode.
-
Click on the corner selection handle and drag it to rotate the object. Release the selection handle when the required object rotation is reached.
-
Notes
The rotation center is normally located at the center of an object. To change the rotation center position, click on the rotation center and drag it until it is at the required position. The rotation center can be repositioned outside of the object.
Rotation works in a slightly different way for 3D objects because it occurs in a three dimensional space and not in a single plane. See Chapter 7, Working with 3D Objects for more information.
Slanting objects
The axis used for slanting an object is the object edge directly opposite the center handle being used to slant the object. This axis is fixed in location while the other sides of the object move in relation to it as the selection handle is dragged. In Figure 12 the selection handle at the center of the object bottom has been used to slant the object.
-
Note
Press and hold the Shift key while rotating or slanting an object restricts movement to 15° steps. This is the default behavior of the Shift key. However, if When creating or moving objects has been selected in Tools > Options > LibreOffice Draw > Grid (macOS LibreOffice > Preferences > LibreOffice Draw > Grid), the Shift key action is reversed and rotation or slanting is restricted to 15° of movement unless the Shift key is pressed.
-
Select an object and use one of the following methods to switch to rotation mode. The selection handles change shape and color and a center of rotation indicator appears in the object center.
-
Click again on a selected object.
-
Click on the triangle ▼ on the right of Transformations on the Line and Filling toolbar and select Rotate from the pop up menu.
-
Go to View > Toolbars > Transformations on the Menu bar to open the Transformations toolbar, then select Rotate.
-
Move the cursor over a selection handle at the midpoint of the object top, bottom, left or right sides and the cursor changes shape to indicate slanting direction.
-
Click and drag the selection handle to slant the object. Release the cursor when the desired object slant is reached. A ghosted object outline being slanted appears and the current angle of slanting is shown in the Status Bar.
Figure 12: Example of slanting objects
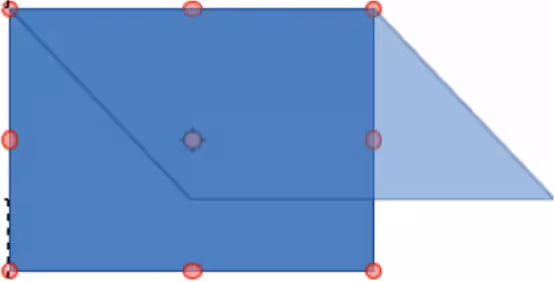
Figure 13: Position and Size dialog
Setting exact position, size, rotation and slant
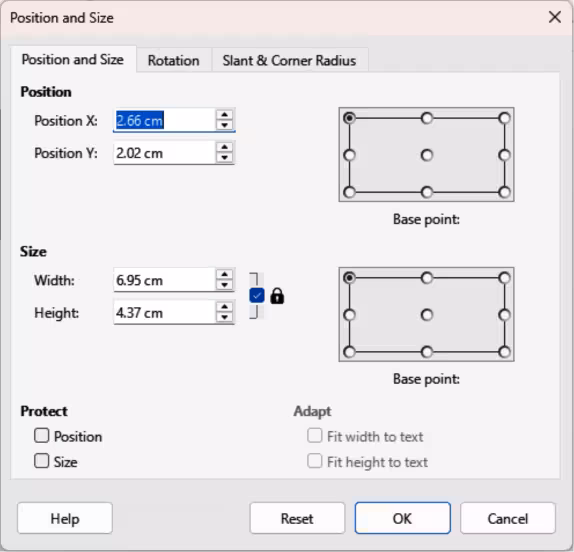
Using the cursor to position and resize objects is not exact. For greater accuracy to position and size an object, use the Position and Size dialog (Figure 13), or the Position and Size panel (Figure 14) in the Properties deck on the Sidebar.
-
To open the Position and Size dialog, select an object using one of the following methods:
-
Go to Format > Position and Size on the Menu bar.
-
Right-click on the object and select Position and Size from the context menu.
-
Use the keyboard shortcut F4.
-
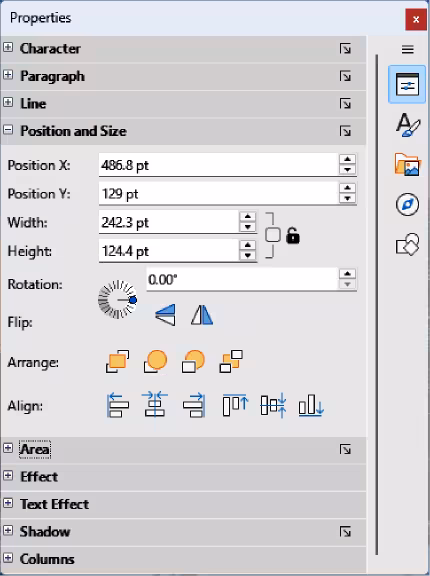
To open the Position and Size panel in the Properties deck on the Sidebar (Figure 14), select an object, then click on Properties on the Sidebar and click on the chevron > on the Position and Size title bar to open the panel.
Position and Size
Position
Position X
Enter the horizontal distance required to move an object relative to the base point selected in the grid.
Position Y
Enter the vertical distance required to move an object relative to the base point selected in the grid.
Figure 14: Position and Size panel in Properties deck on Sidebar
Base point
Select a base point in the grid and then enter the amount required to shift an object relative to the base point that is selected in the Position Y and Position X boxes. The base points correspond to the selection handles on an object. This option is only available in the Position and Size dialog.
-
Note
The position and size default location for a base point is the upper left corner of the drawing area. This base point can be temporarily changed to make positioning or dimensioning simpler by clicking on a position corresponding to the required base point location. This change in base point is only valid for single use and the base point is reset to the default position of top left corner when the Position and Size dialog is closed.
Size
Width
Enter a width for a selected object.
Height
Enter a height for a selected object.
Keep ratio
Maintains proportions when resizing a selected object.
Base point
Select a base point in the grid, and then enter the new size dimensions for a selected object in the Width and Height boxes. This option is only available in the Position and Size dialog.
Protect
Position
Prevents changes to position or size for a selected object.
Size
Prevents object resizing.
Adapt
Fit width to text
Expands an object width to the text width, if the object is smaller than the text.
Fit height to text
Expands an object height to the text height, if the object is smaller than the text.
Rotating objects
To accurately rotate an object, click on the Rotation tab of the Position and Size dialog to open the Rotation page (Figure 15). The options allow the rotation angle and pivot point location to be defined. Alternatively, use the available options for rotation in the Position and Size panel in the Properties deck on the Sidebar (Figure 14).
Pivot Point
Position X
Enter a horizontal distance from the page left edge to change the pivot point position.
Position Y
Enter a vertical distance from the page top edge to change the pivot point position.
Default settings
Select the pivot point position. Default position is the center of an object. Changing the pivot point is valid for single use only and is reset to the default central position when the Position and Size dialog is closed.
Rotation Angle
Angle
Enter the number of degrees that required to rotate the selected object.
Default settings
Click on the indicator to rotate the object. Number of degrees rotated is displayed in the Angle box.
Figure 15: Position and Size dialog — Rotation page
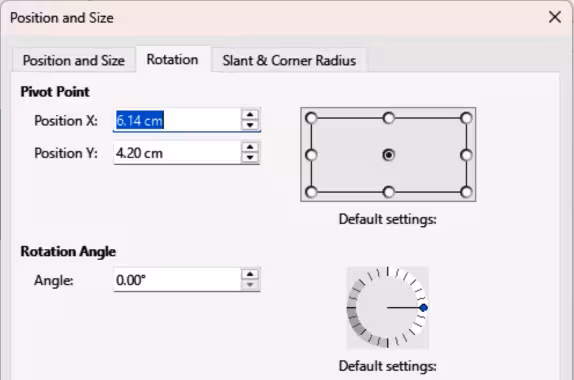
Figure 16: Position and Size dialog — Slant & Corner Radius page
Slant and corner radius
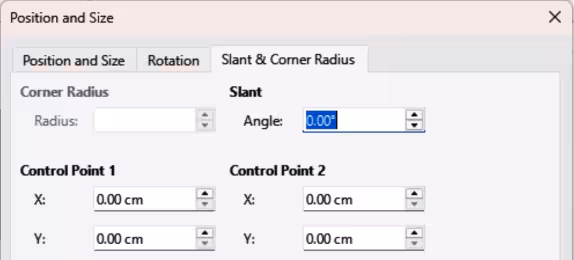
To accurately set a corner radius or slant angle of an object, click on the Slant & Corner Radius tab of the Position and Size dialog (Figure 16) to open the Slant & Corner Radius page. Options for slant and corner radius are only available in the Position and Size dialog.
Corner Radius
Radius
Enter the circle radius that is to be used to round corners. The larger the value for corner radius set, rounded corners become more visible.
Slant
Angle
Enter the slant axis angle. The slant angle relates to how much an object inclines or slants from its normal vertical position on a drawing.
Figure 17: Example of corner point adjustment
Control Point 1/Control Point 2
Using grid and snap functions
Position objects accurately using the Draw grid and snap functions. It is recommended to use the highest practical zoom value for a drawing when using the grid and snap functions. Two different functions can be used at the same time, for example, snapping to a guide line and page edge. It is recommended to only activate snap functions that are required.
Configuring grid and snap
To configure the grid and snap functions in a drawing, go to Tools > Options > LibreOffice Draw > Grid (macOS LibreOffice > Preferences > LibreOffice Draw > Grid) on the Menu bar to open the Options LibreOffice Grid dialog (Figure 18). Grid and snap functions are displayed and selected using one of the following methods:
-
Using the Options LibreOffice Grid dialog.
-
Right clicking on a drawing and selecting options from the context menu.
-
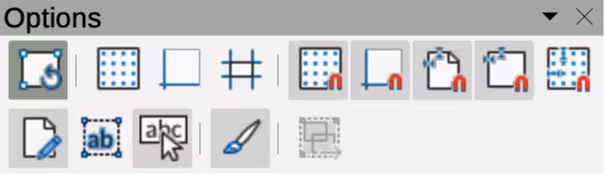
Using the tools on the Options toolbar (Figure 19). If the Options toolbar is not open, go to View > Toolbars > Options on the Menu bar.
Grid and snap functions
Grid
Snap to grid
Specifies whether to move frames, drawing elements, and controls only between grid points. To change the snap grip status only for the current action, drag an object while holding down the Ctrl key (macOS ⌘).
Visible grid
Specifies whether to display the grid.
Figure 18: Options LibreOffice Draw dialog — Grid page
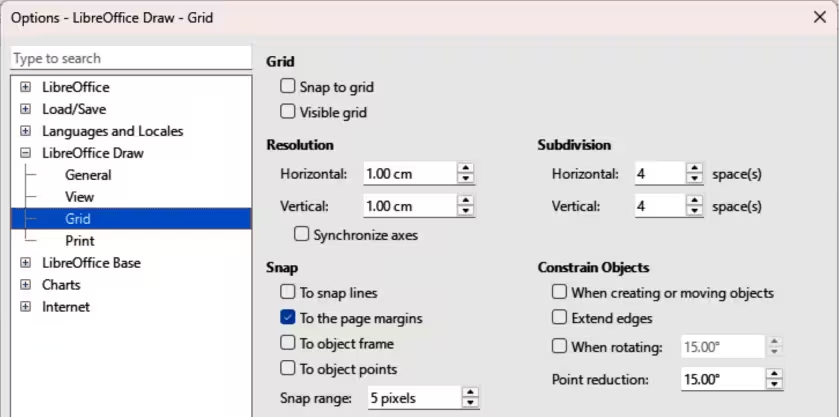
Figure 19: Options toolbar
Resolution
Horizontal
Defines the unit of measure for the spacing between grid points on the X‑axis.
Vertical
Defines the grid points spacing in the desired unit of measurement on the Y‑axis.
Synchronize axes
Specifies whether to change the current grid settings symmetrically. The resolution and subdivision for the X and Y axes remain the same.
Subdivision
Horizontal
Specify the number of intermediate spaces between grid points on the X‑axis.
Vertical
Specify the number of intermediate spaces between grid points on the Y‑axis.
Snap
To snap lines
Snaps the edge of a dragged object to the nearest snap line when the object is released. This setting can also be defined using Snap to Snap Guides on the Options toolbar.
To the page margins
Specifies whether to align the graphic object contour to the nearest page margin. The cursor or a contour line of the graphics object must be in the snap range. This function can also be accessed using Snap to Page Margins in the Options toolbar.
To object frame
Specifies whether to align the graphic object contour to the border of the nearest graphic object. The cursor or a contour line of the graphics object must be in the snap range. This function can also be accessed with Snap to Object Border in the Options toolbar.
To object points
Specifies whether to align the graphic object contour to the points of the nearest graphic object. This only applies if the cursor or a contour line of the graphics object is in the snap range. This function can also be accessed with Snap to Object Points in the Options toolbar.
Snap range
Defines the snap distance between the cursor and the object contour. Snaps to a snap point if the cursor is closer than the distance selected.
Constrain Objects
When creating or moving objects
Specifies that graphic objects are restricted vertically, horizontally or diagonally (45°) when creating or moving them. This setting can be temporarily deactivated by pressing the Shift key.
Extend edges
Specifies that a square is created based on the longer side of a rectangle when the Shift key is pressed before releasing the object. This also applies to an ellipse where a circle is created based on the ellipse longest diameter. When Extend edges is not selected, a square or a circle is created based on the shorter side or diameter.
When rotating
Specifies that graphic objects can only be rotated within the rotation angle that is selected. To rotate an object outside the defined angle, press the Shift key when rotating. Release the object when the desired rotation angle is reached.
Point reduction
Defines the angle for point reduction. When working with polygons, this is useful for reducing editing points.
Snap to grid
Using Snap to Grid
Snap to Grid is used when moving an object onto a grid point in a drawing. This function is selected using one of the following methods:
-
Go to View > Snap Guides > Snap to Grid on the Menu bar.
-
Right-click on a drawing and select Snap Guides > Snap to Grid from context menu.
-
Click on Snap to Grid on the Options toolbar.
Displaying grid
Use one of the following methods to display or hide the grid in a drawing:
-
Go to View > Grid and Helplines > Display Grid on the Menu bar.
-
Click on Display Grid on the Options toolbar.
Snap points and lines
Snap lines and snap points are not part of the grid, but are inserted to position an object at a specific place in a drawing. Snap lines can either be horizontally or vertically and appear as dashed lines. Snap points appear as small crosses with dashed lines. Snap points and snap lines do not appear in printed output.
Figure 20: New Snap Guide dialog
Inserting snap points and snap lines
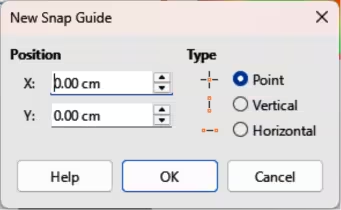
To insert a snap point or snap line, go to Insert > Snap Guide on the Menu bar to open the New Snap Guide dialog (Figure 20).
Position
X:
Enter the amount of space required between the snap point or line and page left edge.
Y:
Enter the amount of space required between the snap point or line and page top edge.
Type
Point
Inserts a snap point.
Vertical
Inserts a vertical snap line.
Horizontal
Inserts a horizontal snap line.
Displaying snap points and lines
Use one of the following methods to display snap points and lines in a drawing:
-
Go to View > Snap Guides > Display Snap Guides on the Menu bar.
-
Click on Display Snap Guides in the Options toolbar.
-
Right-click on a drawing and select Snap Guides > Display Snap Guides from the context menu.
Editing snap points
-
Right-click on the snap point and select Edit Snap Point from the context menu to open the Edit Snap Point dialog (Figure 21).
-
Enter new X and Y coordinate settings for the snap point and click OK.
-
Alternatively, click and drag a snap point to a new position on a drawing.
Figure 21: Edit Snap Point dialog
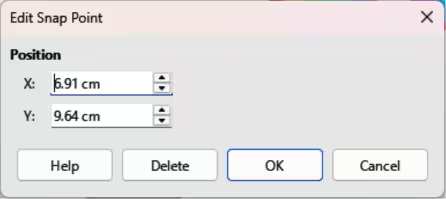
Figure 22: Edit Snap Line dialog
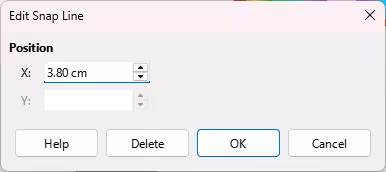
Editing snap lines
-
Right-click on the snap line and select Edit Snap Line from the context menu to open the Edit Snap Line dialog (Figure 22).
-
Enter a new X coordinate setting for vertical snap lines or a new Y coordinate setting for horizontal snap lines and click OK.
-
Alternatively, click and drag a snap line to a new position on a drawing.
Deleting snap points and lines
-
To delete a snap point, drag it back to a ruler or right-click on the snap point and select Delete Snap Point from the context menu.
-
To delete a snap line, drag it back to the ruler or right-click on the snap line and select Delete Snap Line from the context menu.
Configuring snap range
To configure the snap range of when an object snaps to a position in the drawing:
-
Go to Tools > Options > LibreOffice Draw > Grid (macOS LibreOffice > Preferences > LibreOffice Draw > Grid) on the Menu bar to open the Options LibreOffice Grid dialog.
-
Enter the number of pixels to set the proximity of when the object will snap into position in the Snap range box. The default setting is 5 pixels.
-
Click OK to set the new snap range and close the dialog.
Figure 23: Example of using helplines when moving objects
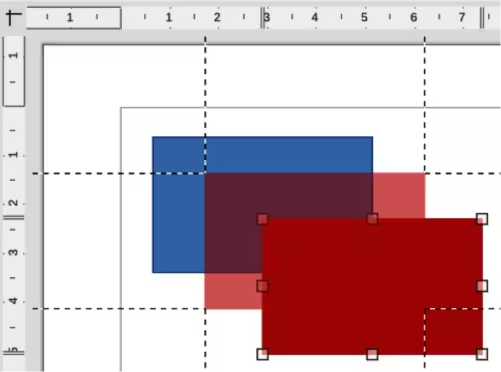
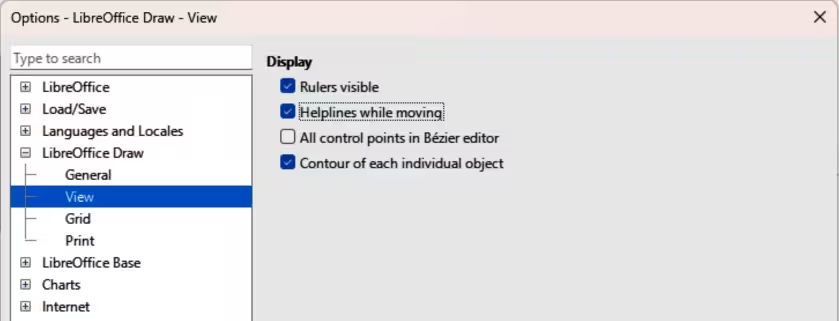
Figure 24: Options LibreOffice Draw View dialog
Using Helplines
Helplines are a Draw function for positioning of objects. Helplines are displayed while the object is being moved. Helplines extend from the object edges to the rulers at the top and left side of a drawing and do not have a snap function (Figure 23).
-
Go to Tools > Options > LibreOffice Draw > View (macOS LibreOffice > Preferences > LibreOffice Draw > View) on the Menu bar to open the Options LibreOffice Draw View dialog (Figure 24).
-
Select Helplines when moving option or click Helplines While Moving in the Options toolbar.
-
Click OK to save the selection and close the dialog.
Changing object shape
Regular shapes
When creating regular shapes in a drawing, some shapes have one or more control dots displayed in a different color to the selection handles after selecting an object. When the cursor hovers over one of these dots, it changes shape. Click and drag a control dot to modify the object shape. For example, increasing corner radius of a rounded rectangle or square, changes the angles of an arc, and so on. Control dots have different functions according for each shape.
-
Note
After converting a regular shape to a curve or polygon, the shape can be changed and points can be edited. See “Curves and polygons” below and “Editing points” below for more information.
Basic shapes
The following basic shapes located on the Basic Shapes sub‑toolbar (Figure 25) and listed in Table 1 have control dots.
Figure 25: Basic Shapes sub‑toolbar
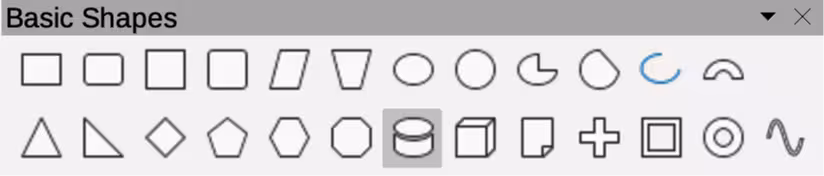
Table 1: Basic shapes with control dots
|
Basic Shapes |
Control dot description |
|
Rectangle, Rounded |
Changes the curve radius that replaces the angled corners of a rectangle or square. |
|
Square, Rounded |
Changes the curve radius that replaces the angled corners of a rectangle or square. |
|
Parallelogram |
Changes the internal angles between the sides. |
|
Trapezoid |
Changes the internal angles between the sides. |
|
Circle Pie |
Changes the size of the filled sector. |
|
Block Arc |
Changes both internal diameter and size of the filled area. |
|
Isosceles Triangle |
Changes the shape and type of the triangle. |
|
Hexagon |
Changes the internal angles between the sides. |
|
Octagon |
Changes the internal angles between the sides. |
|
Cylinder |
Changes the perspective. |
|
Cube |
Changes the perspective. |
|
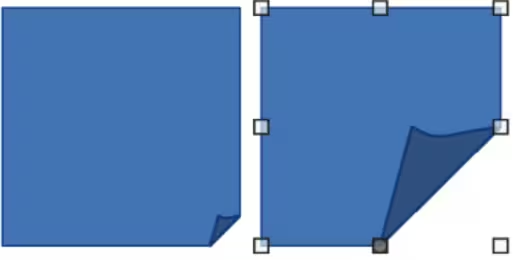
Folded Corner |
Changes the folded corner size. |
|
Cross |
Changes the thickness of the cross four arms. |
|
Frame |
Changes the frame thickness. |
|
Ring |
Changes the ring internal diameter. |
Symbol shapes
The following symbol shapes located on the Symbol Shapes sub‑toolbar (Figure 26) and listed in Table 2 have control dots.
Figure 26: Symbol Shapes sub‑toolbar
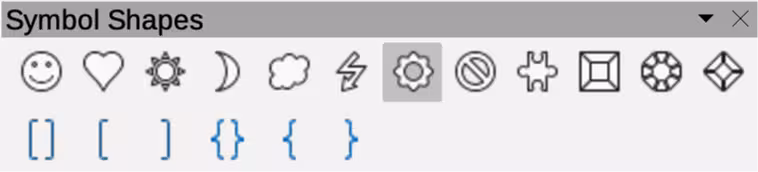
Table 2: Symbol shapes with control dots
|
Symbol Shapes |
Control dot description |
|
Smiley Face |
Changes the smile on the face. |
|
Heart |
Changes the symbol shape. |
|
Sun |
Changes the symbol shape. |
|
Moon |
Changes the symbol shape. |
|
Prohibited |
Changes the ring thickness and the diagonal bar. |
|
Square Bevel |
Changes the bevel thickness. |
|
Octagon Bevel |
Changes the bevel thickness. |
|
Diamond Bevel |
Changes the bevel thickness. |
|
Double Bracket |
Changes the bracket curvature. |
|
Left Bracket |
Changes the bracket curvature. |
|
Right Bracket |
Changes the bracket curvature. |
|
Double Brace |
Changes the bracket curvature. |
|
Left Brace |
Changes the brace curvature and the position of the point. |
|
Right Brace |
Changes the brace curvature and the position of the point. |
Block arrows
The following block arrows located on the Block Arrows sub‑toolbar (Figure 27) and listed in Table 3 have control dots.
Figure 27: Block Arrows sub‑toolbar
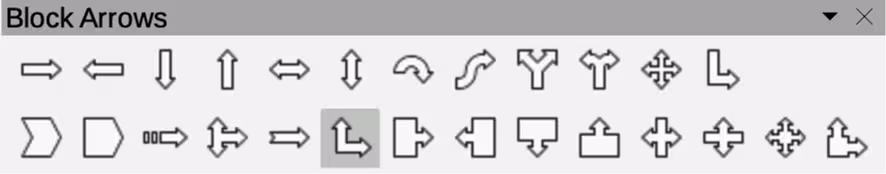
Table 3: Block arrows with control dots
|
Block Arrows |
Control dot description |
|
Right Arrow |
Changes the arrow shape and thickness. |
|
Left Arrow |
Changes the arrow shape and thickness. |
|
Down Arrow |
Changes the arrow shape and thickness. |
|
Up Arrow |
Changes the arrow shape and thickness. |
|
Left and Right Arrow |
Changes the arrow shape and thickness. |
|
Up and Down Arrow |
Changes the arrow shape and thickness. |
|
Circular Arrow |
Changes the arrow shape and thickness. |
|
4-way Arrow |
Changes the arrow shape and thickness. |
|
Chevron |
Changes the angle between the sides and the shape. |
|
Pentagon |
Changes the angle between the sides and the shape. |
|
Striped Right Arrow |
Changes the arrow shape and thickness. |
|
Up, Right and Down Arrow |
Changes the arrow shape and thickness. |
|
Notched Right Arrow |
Changes the arrow shape and thickness. |
|
Up and Right Arrow |
Changes the arrow shape and thickness. |
|
Right Arrow Callout |
Changes the callout shape and thickness. |
|
Left Arrow Callout |
Changes the callout shape and thickness. |
|
Down Arrow Callout |
Changes the callout shape and thickness. |
|
Up Arrow Callout |
Changes the callout shape and thickness. |
|
Left and Right Arrow Callout |
Changes the callout shape and thickness. |
|
Up and Down Arrow Callout |
Changes the callout shape and thickness. |
|
4-way Arrow Callout |
Changes the callout shape and thickness. |
|
Up and Right Arrow Callout |
Changes the callout shape and thickness. |
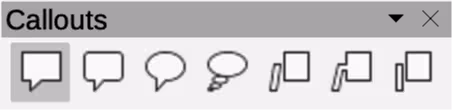
Callouts
For all callouts on the Callouts sub‑toolbar (Figure 28) use control dots to change length, position and angle of a pointer.
Figure 28: Callouts sub‑toolbar
Stars and banners
The following stars and banners located on the Stars and Banners sub‑toolbar (Figure 29) and listed in Table 4 have control dots.
Figure 29: Stars and Banners sub‑toolbar
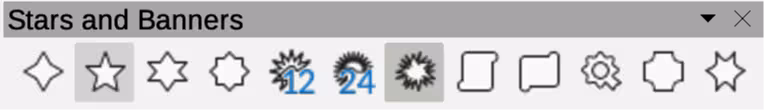
Table 4: Stars and banners with control dots
|
Stars and Banners |
Control dot description |
|
4-Point Star |
Changes the star points thickness and shape. |
|
8-Point Star |
Changes the star points thickness and shape. |
|
24-Point Star |
Changes the star points thickness and shape. |
|
Vertical Scroll |
Changes the scroll width and shape. |
|
Horizontal Scroll |
Changes the scroll width and shape. |
|
Doorplate |
Changes the inward curvature of the corners. |
Curves and polygons
Bézier curves
The editing of curves and polygons depends on the mathematics of Bézier curves. Fully explaining Bézier curves goes beyond the scope of this Draw Guide. For more information on drawing and manipulating Bézier curves, see Chapter 11, Advanced Draw Techniques.
Editing a Bézier curve is the movement of points or tangents passing through a point. Each tangent has a control point at each end and a junction point where it meets a curve. The relative angle and distance between control points determines the curve shape. Figure 30 shows a square and moving only one point on the square.
Converting objects to curve or polygon
When changing the shape of an object and before modifying the points on an object, it must be converted to a curve or a polygon. Depending on what kind of shape and effect required, use one of the following methods to create a curve or a polygon:
-
Select an object, go to Shape > Convert on the Menu bar, then select either To Curve or To Polygon.
-
Right click on an object and select Convert > To Curve or To Polygon from the context menu.
Figure 30: Example of creating different shapes using tangent points
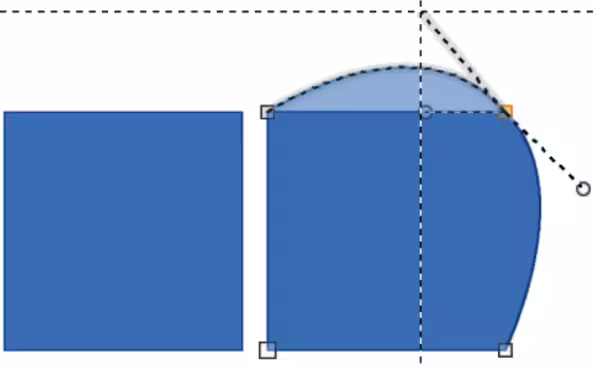
Figure 31: Edit Points toolbar
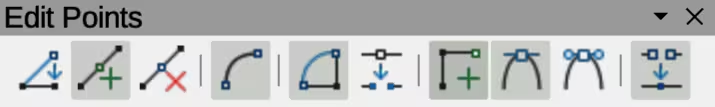
Editing points
Many different shapes can be created by moving either the point, or one or both of the round handle points at either end of the tangent, as shown in Figure 30. Points can be added, deleted, or points type changed using tools available on the Edit Points toolbar (Figure 31).
-
Convert a shape to a curve or polygon.
-
Select the converted object and then select the points editing mode using one of the following methods:
-
Go to Edit > Points on the Menu bar.
-
Click on Toggle Edit Point Mode on the Standard toolbar.
-
Right click on the converted object and select Toggle Edit Point Mode from the context menu.
-
Use the keyboard shortcut F8.
-
Click on an object point to change the object shape. The Edits Points toolbar opens and the tools become active when a point is selected. Tangents also appear attached to the selected point.
-
Use the various tools on the Edit Points toolbar to add, delete, or change point type.
-
Click and drag a point to move the point and change object shape.
-
If the selected object is a curve, click on and drag the round points at the end of a tangent to change the object shape.
-
When satisfied with the shape, click outside of the object to cancel points editing mode and close the Edit Points toolbar.
Point types
The available tools on the Edit Points toolbar depend on the object and type of object point that has been selected.
Move Points
Insert Points
Delete Points
Convert To Curve
Close Bézier
Split Curve
Corner Point
Smooth Transition
Tangents
Before using tangents on an object, it must be converted to a curve. Tangents are only used on curves. If an object has been converted to a polygon and a tangent is added, the object is automatically converted to a curve.
-
Note
The tangent angle relates to an object shape that is changed by selecting a tangent control point at the end of a tangent and moving it. As the tangent angle is changed, the object shape changes in response.
Figure 32: Example of symmetric transition
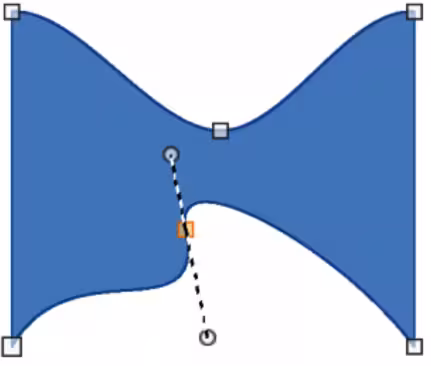
Symmetric transition
Symmetric transition converts a corner or smooth point into a symmetrical point. Tangents have the same length and are aligned in a straight line, as shown in Figure 32. Tangents can only be moved simultaneously and the degree of curvature is the same in both directions.
-
Convert an object to a curve or polygon.
-
Select the converted object and open the Edit Points toolbar.
-
Select a point to change to a symmetrical point.
-
Click on Symmetric Transition in the Edit Points toolbar. The straight line on each side of the symmetric transition point is converted to a curve.
-
Click and drag a tangent control handle to change the object curvature and shape. Any change to one tangent is carried over symmetrically to the other tangent.
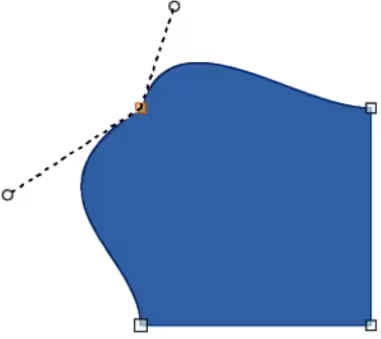
Smooth transition
Converts selected points into corner points. Tangents are aligned in a straight line and move simultaneously. Tangents can have different lengths with the curvature controlled by the longest tangent which is the largest curvature, as shown in Figure 33.
-
Convert the object to a curve or polygon.
Figure 33: Example of smooth transition
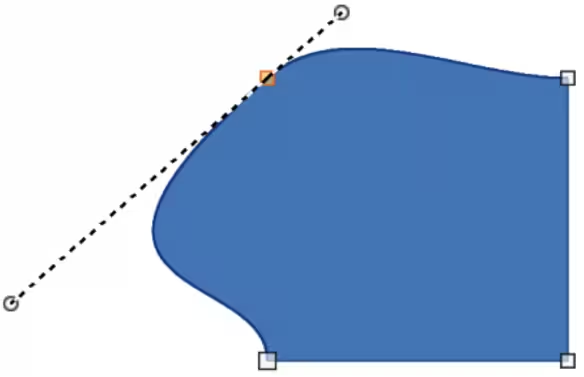
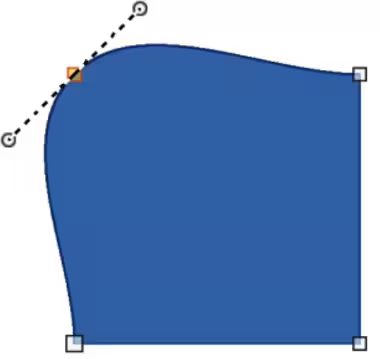
Figure 34: Example of changing corner point
-
Select the converted object and open the Edit Points toolbar.
-
Select the point to be changed to a symmetrical point.
-
Click on Smooth Transition on the Edit Points toolbar.
-
Click and drag a tangent control handle to change the object shape. This creates an asymmetric tangent with the largest curvature on the tangent longest side.
Corner point
Converts a selected point or points into corner points. Corner points have two movable control points, independent from each other. It is possible to independently change the angle on each side of a tangent using the tangent central point as a corner point, as shown in Figure 34.
Points
Moving points
When moving points, the object border on both sides of the point follows the point movement changing the object shape. This also referred to as distorting objects.
-
Convert the object to a curve or a polygon.
-
Select the converted object and open the Edit Points toolbar.
-
Select the point to be changed to a symmetrical point.
Figure 35: Example of moving points
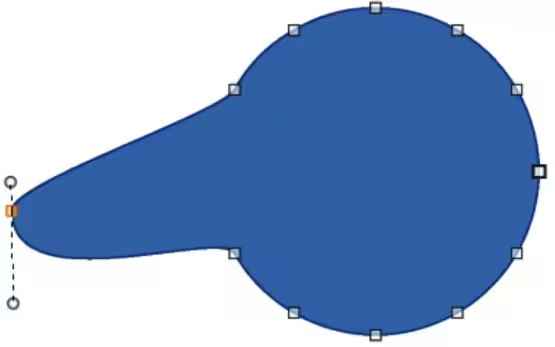
Figure 36: Example of inserting and moving points
-
Click on Move Points on the Edit Points toolbar.
-
Place the cursor on the selected point, then click and drag the point creating a new shape. Figure 35 illustrates how a different shape is created from a circle by dragging the left hand side point to the left.
Inserting points
A smooth point is inserted into a selected object each time there is a click. Clicking and dragging an inserted point changes object shape at the new point, as shown in Figure 36.
-
Convert the object to a curve or a polygon.
-
Select the converted object and open the Edit Points toolbar.
-
Click on Insert Points on the Edit Points toolbar.
-
Click on the object border, or inside the object, to insert a point, then drag the cursor to move the inserted point and create a new shape.
-
Release the inserted point when the required shape is created.
-
If required, click and drag the end of a tangent to change its angle. Each tangent can be moved independently creating spikes and troughs in an object shape.
Deleting points
Figure 37 is an example of what happens when three points on the left were deleted from a circle. The left image is a the full circle and the right image is where three points have been deleted creating a new shape.
-
Convert the object to a curve or a polygon.
-
Switch the selected object into editing points mode and open the Edit Points toolbar.
-
To delete a single point, proceed as follows
-
Select the point for deletion.
-
Click on Delete Points on the Edit Points toolbar.
-
To delete several points at the same time, proceed as follows:
-
Hold down the Shift key.
-
Select all the points for deletion.
-
Click on Delete Points on the Edit Points toolbar.
Figure 37: Example of deleting points
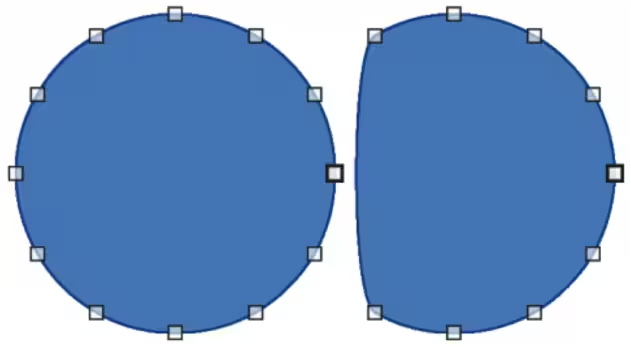
Figure 38: Example of converting curve to a line
|
|
|
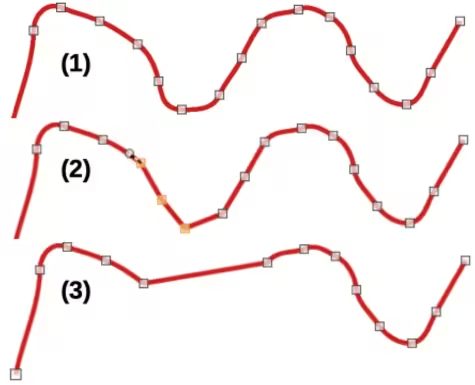
Eliminating points
Eliminate Points on the Edit Points toolbar only functions on lines with multiple points. These lines are created when a curve is converted to a line using Convert to Curve. An example of creating a straight line and eliminating points is shown in Figure 38.
-
Convert the curve to a curve or a polygon.
-
Switch the curve into editing points mode and open the Edit Points toolbar.
-
Select the curve with multiple points and convert to a line, see “Converting curves or lines” below.
-
Select the point or points on the line for elimination. The selected point is emphasized.
-
Select Eliminate Points on the Edit Points toolbar.
-
Accurately position the cursor over the selected point, then click and drag the selected point. As the cursor is dragged, a dotted line forms between the neighboring points.
-
When this dotted line appears to be a straight line between the neighboring points, release the selected point. The selected point is eliminated and a straight line now exists between the neighboring points.
Converting curves or lines
Curves and lines are converted using Convert to Curve on the Edit Points toolbar. When a curve is converted to a line, a straight line is created between selected points on a curve. When a line is converted to a curve, a curve is created between selected points on a line. An example of converting a curve to a line is shown in Figure 38.
-
Convert the object to a curve or a polygon.
-
Switch the object into editing points mode and open the Edit Points toolbar.
-
Select the points for converting from curve to line or from line to curve.
-
Click on Convert to Curve on the Edit Points toolbar. Between the selected points, a curve is converted into a line or a line is converted into a curve.
-
Delete a point on the converted line to create a straight line.
Splitting objects
-
Convert the object to a curve or a polygon.
-
Switch the object into editing points mode and open the Edit Points toolbar.
-
Select the point or points on the object where it is to be split. Keep the Shift key pressed down when selecting more than one point.
-
Click on Split Curve on the Edit Points toolbar to split or cut the object border at the selected point. If the object is filled, it will be emptied because the object border is no longer closed, as shown in Figure 39.
-
Deselect the object, then drag the cut segment and move it away from the original object.
-
Note
The point where the object was split is now larger than the remaining points visible on the object.
Figure 39: Example of splitting objects
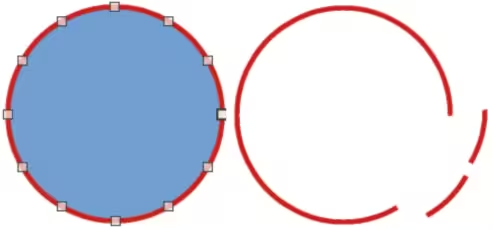
Figure 40: Example of closing objects
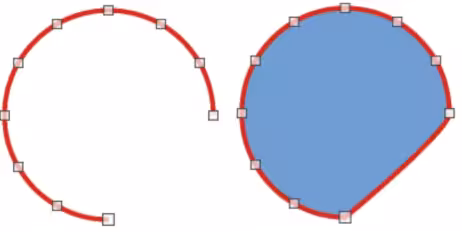
Closing objects
-
Select an open object (Figure 40).
-
Switch the object into editing points mode and open the Edit Points toolbar.
-
Select a point where the object has been split. Note that the start point of an object is larger than the other points visible on the object.
-
Click on Close Bézier in the Edit Points toolbar to close the object. If the open object was originally a closed and filled object, then the original color fills the object when it is closed.