
Draw Guide 7.2
Chapter 6,
Editing Images
Raster Graphics
This document is Copyright © 2021 by the LibreOffice Documentation Team. Contributors are listed below. This document maybe distributed and/or modified under the terms of either the GNU General Public License (https://www.gnu.org/licenses/gpl.html), version 3 or later, or the Creative Commons Attribution License (https://creativecommons.org/licenses/by/4.0/), version 4.0 or later.
All trademarks within this guide belong to their legitimate owners.
|
Peter Schofield |
|
|
|
John Cleland |
Martin Fox |
Jean Hollis Weber |
|
John A Smith |
Peter Schofield |
Regina Henschel |
|
Claire Wood |
Elzett Kotze |
|
Please direct any comments or suggestions about this document to the Documentation Team’s mailing list: documentation@global.libreoffice.org
Note
Everything sent to a mailing list, including email addresses and any other personal information that is written in the message, is publicly archived and cannot be deleted.
Published December 2022. Based on LibreOffice 7.2 Community.
Other versions of LibreOffice may differ in appearance and functionality.
Some keystrokes and menu items are different on macOS from those used in Windows and Linux. The table below gives some common substitutions for the instructions in this document. For a detailed list, see the application Help.
|
Windows or Linux |
macOS equivalent |
Effect |
|
Tools > Options |
LibreOffice > Preferences |
Access setup options |
|
Right-click |
Control+click or right-click depending on computer setup |
Open a context menu |
|
Ctrl (Control) |
⌘ (Command) |
Used with other keys |
|
F11 |
⌘+T |
Open the Styles deck in the Sidebar |
Previous chapters in this Draw Guide have dealt only with vector graphics and the most common types of vector graphics in use are as follows:
SVG (Scalable Vector Graphics) – an Extensible Markup Language (XML) based vector image format for two-dimensional graphics with support for interactivity and animation.
EPS (Encapsulated PostScript) – a PostScript document format usable as a graphics file format. EPS files are more-or-less self-contained, reasonably predictable PostScript documents that describe an image or drawing and can be placed within another PostScript document.
AI (Adobe Illustrator) – a proprietary file format developed by Adobe Systems for representing single-page vector-based drawings in either the EPS or PDF formats.
However, Draw also contains a number of functions for handling raster graphics (bitmaps) such as photographs and scanned pictures, including import, export, and conversion from one format to another.
Draw can read all the majority of graphic file formats. It has a subset of capabilities similar to raster graphics programs like Adobe Photoshop or Gimp. Raster graphics are generally images or pictures that use one of the following formats, which are the most common formats in use:
JPG/JPEG – acronym for Joint Photographic Experts Group which created the format. It is the most common image format on websites and most digital cameras produce JPEG images as default.
GIF (Graphics Interchange Format) – GIF is a bitmap image format that is popular because of its wide support and portability.
PNG (Portable Network Graphics) – PNG is a raster image format which supports lossless data compression and also background transparency.
TIF/TIFF (Tagged Image File Format) – TIFF is flexible, adaptable, and capable of storing image data in a lossless format.
BMP (BitMaP) – it is also known as bitmap image file, which is a dot matrix data structure.
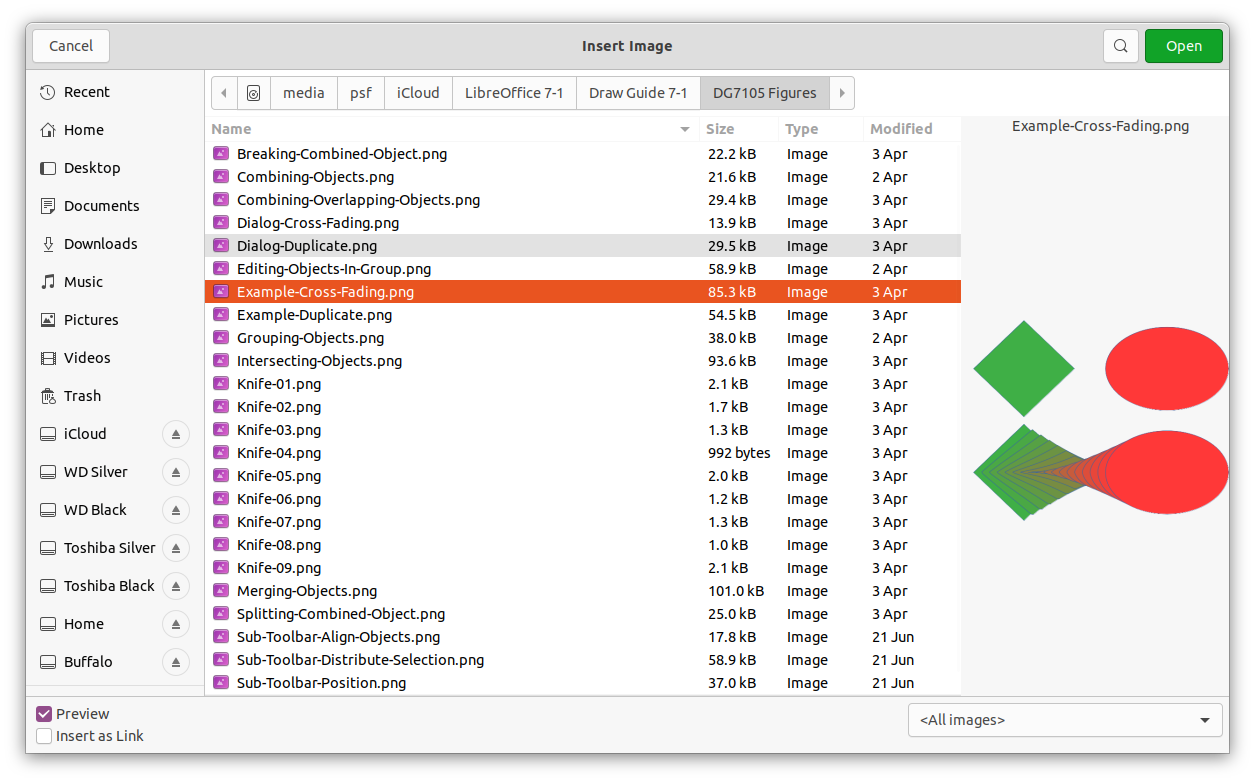
To import image files into a drawing, go to Insert > Image on the Menu bar or click on Insert Image on the Standard toolbar to open the Insert Image dialog (Figure 1).
Draw contains import filters for the majority of graphic formats. If the file being imported has a graphic format not covered by the import filters, then it is recommended to use one of the many free graphic conversion programs to convert the file into a format that Draw recognizes.
If Preview is selected in the Insert Image dialog, a preview of the file is shown in the box on the right-hand side. This makes it easier to select the file required and also checks that Draw can import the file format used.
Embedding a graphic into a drawing makes the image a permanent part of the drawing. Any changes made to an embedded graphic only appear in the drawing where the graphic was embedded. The original graphic file is not affected.
Figure 1: Insert Image dialog
Embedding happens when a graphic is imported into a drawing using one of the following methods:
Insert Image dialog.
Copying and pasting.
Scanning a graphic.
Dragging and dropping between open files.
The main advantage of embedding graphics into a drawing is that the graphic is always available no matter what computer is used to open the drawing.
The main disadvantage of embedding graphics is that it creates large file sizes, which may not be desirable if there is limited capacity for storing computer files. Also, if the original graphic is altered, then the embedded graphic is not updated each time the drawing is opened.
Note
When a graphic is to be embedded into a LibreOffice drawing, make sure that the Insert as Link option is not selected in the Insert Image dialog.
Linking to the original graphic does not insert the graphic into a drawing, but creates a link to where the original graphic file is located on the computer. Each time the drawing is opened, any linked graphics are displayed in the drawing.
The main advantage of linking a graphic file when placed in a drawing is that if the original graphic file is altered or replaced with a graphic using the same filename, the version of the graphic in the drawing is always up to date. The next time the drawing is opened, the latest version of the graphic is also opened in the drawing. Also the file size of the drawing is much smaller and the original graphic can easily be edited with specialized external applications.
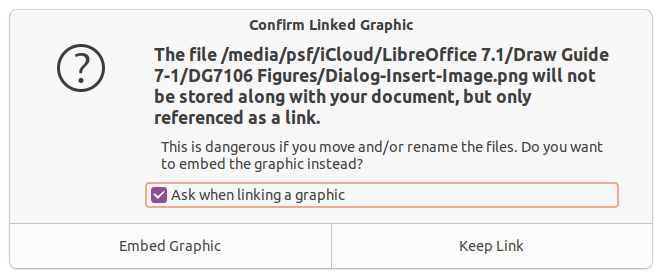
Figure 2: Confirm Linked Graphic dialog
The main disadvantage of linking graphics is that the link must be maintained between the drawing and the embedded graphic file for linking to work correctly. If the drawing or original graphic file is moved to another computer location, then any links must be updated to include the new location.
1) Open the Insert Image dialog.
2) Select Insert as Link in the Insert Image dialog.
3) Select the required graphic file and click on Open to open the Confirm Linked Graphic dialog (Figure 2).
4) Click on Keep Link to link the file and close the Confirm Linked Graphic dialog.
5) If necessary, click on Embed Graphic to embed the file if it is not to be linked. This also closes the Confirm Linked Graphic dialog.
Note
When a graphic file is linked to a LibreOffice drawing, the format of the linked graphic is not changed.
Links can be updated, modified, or broken as follows:
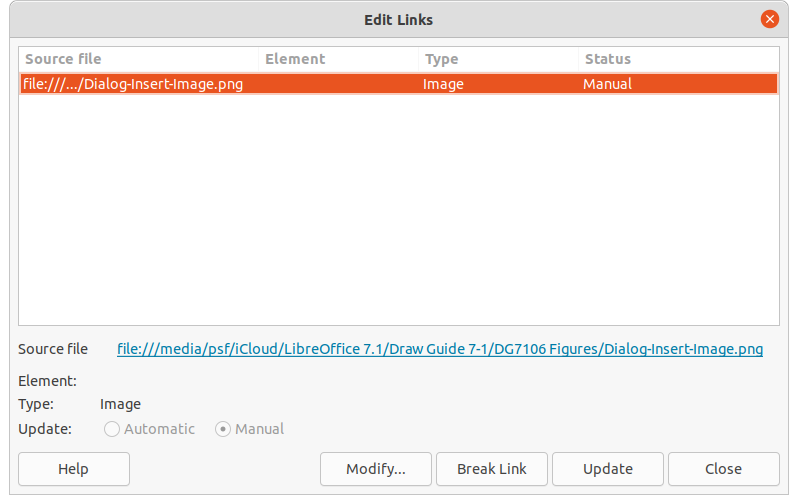
1) Go to Edit > Links to External File on the Menu bar to open the Edit Links dialog (Figure 3).
2) Select the link to be edited.
3) Click on Modify, Break Link, or Update as appropriate.
Modify – changes the graphic file in the drawing to the graphic file that uses the selected link.
Break Link – breaks the link between the selected file and the current document. The version of the graphic file in the drawing becomes embedded into the drawing. A confirmation dialog opens asking if the link is to be broken. Click on Yes to confirm the breaking of the link.
Update – updates the selected link so that the most recent version of the linked file is displayed in the drawing.
4) Click on Close to save the changes to the link and close the Edit Links dialog.
Figure 3: Edit Links dialog
With most scanners a scanned image can be inserted into a drawing or document. Scanned images are embedded using PNG format. Make sure the scanner is configured for the computer and supported by the SANE system for a Linux operating system, or TWAIN for a Windows or Mac operating system.
1) Place a document, drawing, or photograph in the scanner and make sure that the scanner is switched on and ready.
2) If this is the first time the scanner has been used with LibreOffice, go to Insert > Media > Scan > Select Source on the Menu bar to select the scanner. If the scanner has been used before, go to Insert > Image > Scan > Request on the Menu bar.
3) The rest of the procedure depends on the scanner driver, interface, and computer operating system. Normally, scanning options need to be specified such as resolution, scan window, and so on. Consult the documentation that came with the scanner for more information.
4) When the image has been scanned, Draw places it in the drawing. At this point it can be edited like any other graphic.
Note
If more than one scanning device is connected to the computer, the device is selected when the source is selected. This selection becomes the default source when using scan requests until another device is selected and used as the scanning source.
Copying and pasting a graphic into a drawing is another way of embedding graphics. The copied graphic can be an image already embedded in another document or drawing, or it can be a graphic file such as a drawing, document, or photograph.
After copying, select the format for pasting a graphic into Draw using Edit > Paste Special > Paste Special on the Menu bar to open the Paste Special dialog. Available formats for pasting depend on the type of image copied onto the clipboard.
Note
When copying and pasting images into a drawing, please respect the copyright and license of the image being copied.
Dragging and dropping is another method of embedding graphics into a drawing and can be used on graphics that have been embedded or linked. The way that dragging and dropping works is determined by the computer operating system. Behavior of dragging and dropping is normally controlled using the Ctrl or Ctrl+Shift keys in combination with the mouse.
Objects and images which are used frequently can be stored in the Draw Gallery. From the Gallery, a copy of the object or image can be simply dragged onto the drawing. Working with the Gallery is dealt with in Chapter 11, Advanced Draw Techniques.
By default Draw saves drawings in the *.ODG format and some software programs cannot open these files. To make drawings available for other programs, the file can be exported in various formats. The export procedure used depends on the computer setup and computer operating system being used. The following procedure is an example export procedure.
1) Open the ODG file being exported.
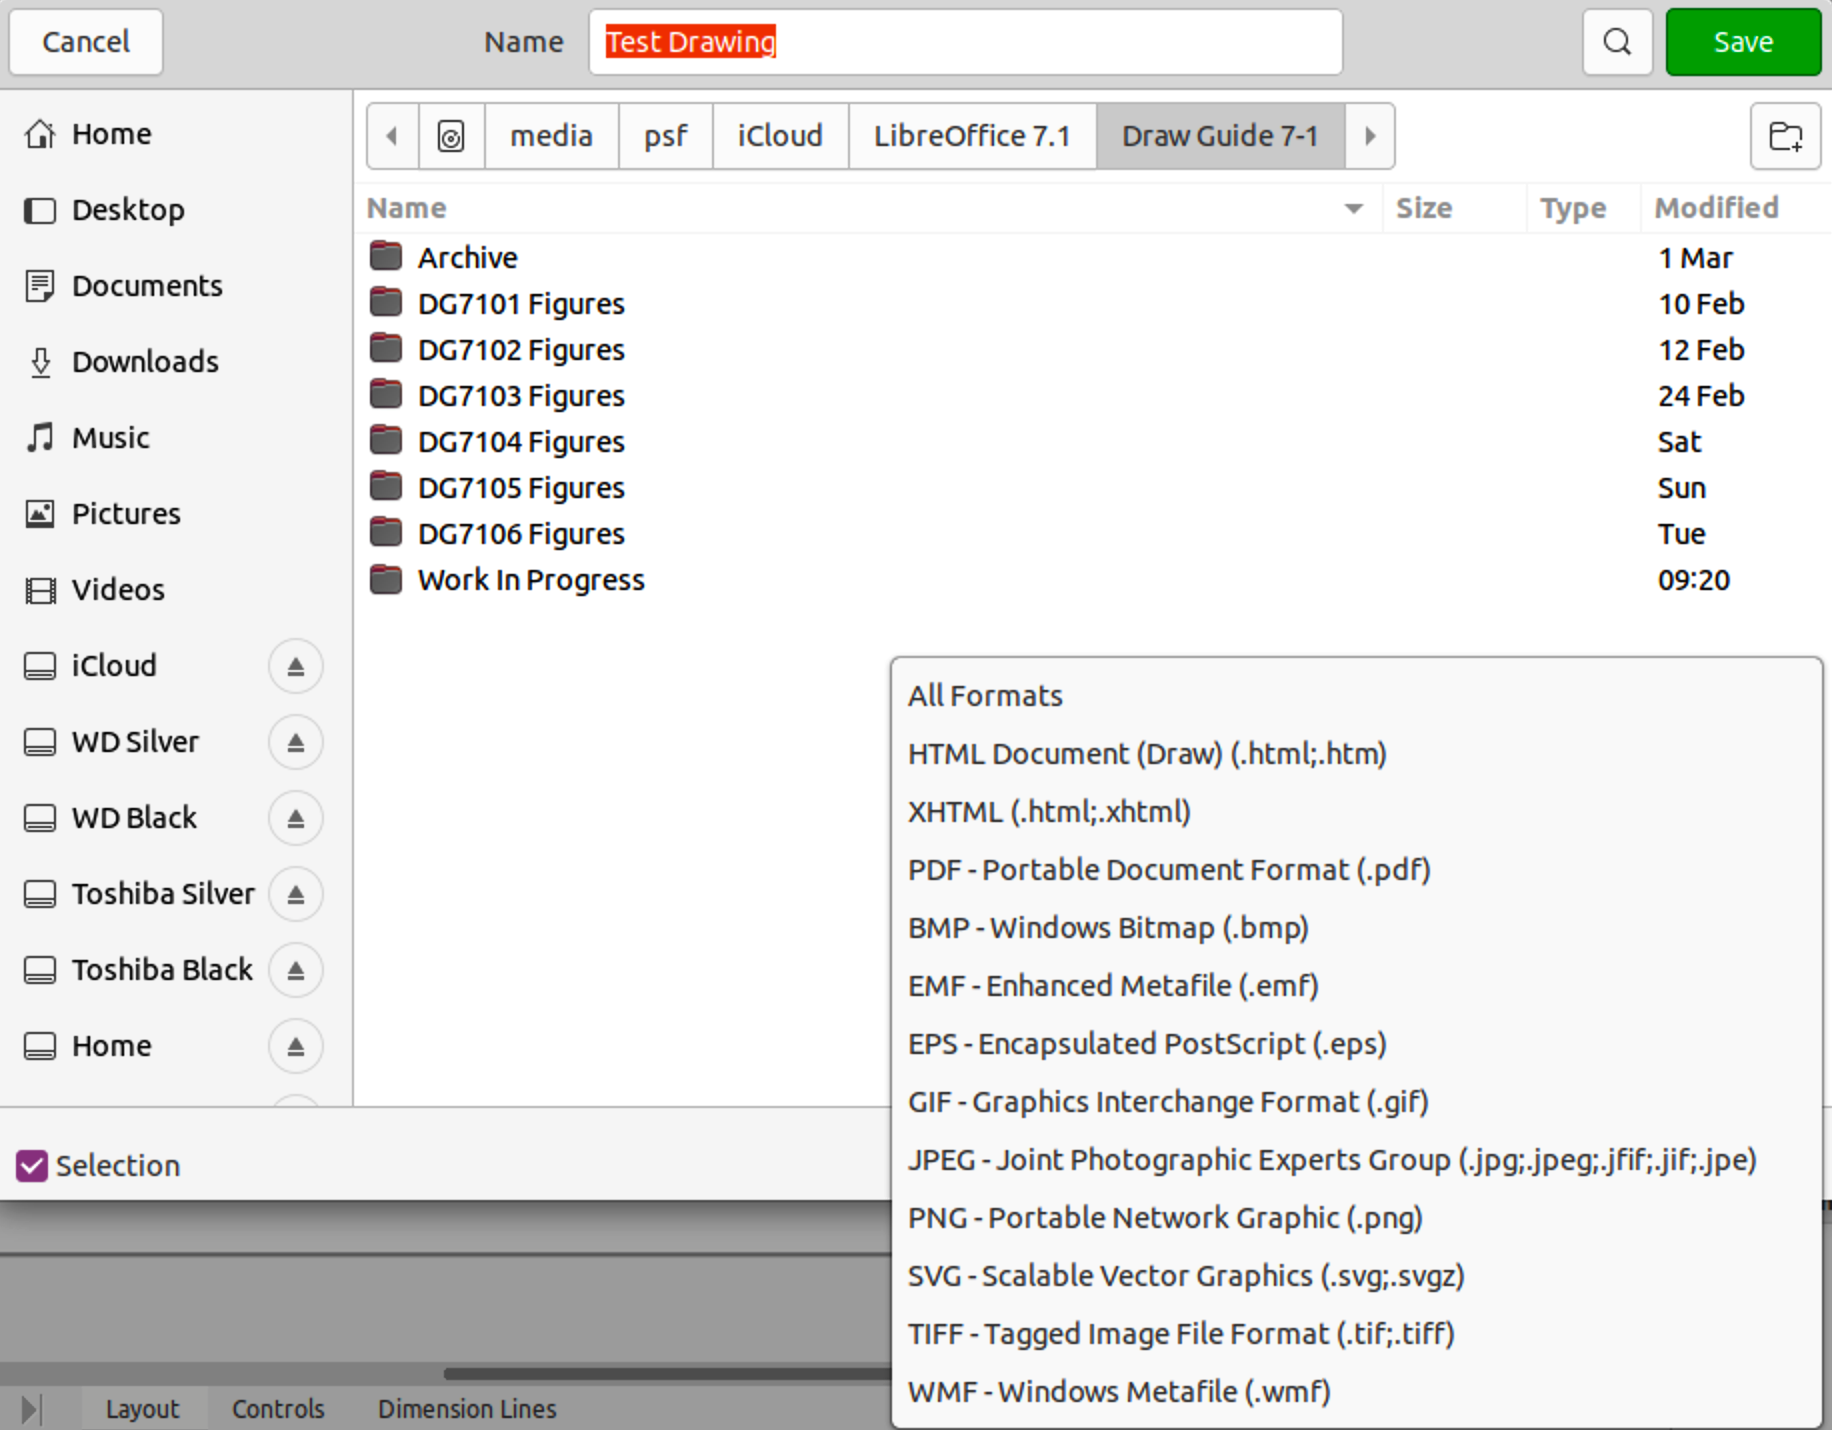
2) Go to File > Export on the Menu bar and open the Export dialog. An example of an export dialog is shown in Figure 4.
3) Enter a new filename for the exported file and navigate to the folder where the exported file is to be saved.
4) Select the required file format from the options in the drop-down list.
5) Click Export and the file is exported as a new file in the selected file format.
6) Depending on the file format selected, another dialog may open allowing options to be selected for the export format.
7) Depending on the additional dialog that may open, click on Export, Create, or OK and the file is exported as a new file in its new format.
Exporting individual objects, or a group of objects, from a drawing file is similar to “Exporting files” above. Open a drawing file and then select the object or objects for export. Make sure to choose the Selection option in the export dialog, as shown in Figure 4.
Using this method, an imported image can be modified, annotations added to it, and make any other changes, then select it and export for use in another drawing or document.
Figure 4: Example export dialog
Images (raster graphics) can be edited and formatted using one of the following methods to add or change filters and adjust the properties of color, lines, areas, and shadows:
Go to Format > Image on the Menu bar and use one of the tools in the sub-menu that opens.
Use the tools on the Image toolbar. See “Image toolbar” on below for more information.
Use the tools available in the Shadow and Image panels on the Properties deck of the Sidebar (Figure 6).
Some raster graphics may have a text element. For more information on formatting text, see Chapter 9, Adding and Formatting Text.
Raster graphics included in a group behave like other objects when the properties of the group are edited and formatted.
Note
Any formatting changes made to a graphic using the tools in LibreOffice only appear in the drawing where the graphic was modified. The original graphic file is not affected.
Draw names objects, including inserted images, Shape 1, Shape 2, and so on, in the order of insertion into a drawing. It is recommended to rename objects, including images in a drawing, with a unique name. Names make images and other objects easily identifiable in the LibreOffice Navigator.
1) Select an image, then use one of the following methods to open the Name dialog and create a unique name for the selected image:
Go to Format > Name on the Menu bar.
Right-click on the image and select Name from the context menu.
2) Enter a name in the Name box and click OK.
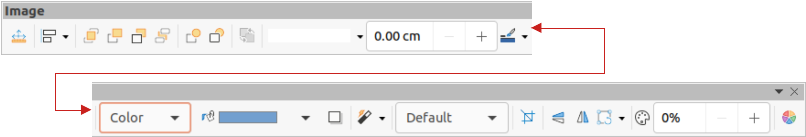
The Image toolbar (Figure 5) normally appears when an image or picture that is a raster graphic is selected. The Image toolbar can be fixed at the top of a drawing or as a floating toolbar. The default set of tools on the Image toolbar are as follows. For more information on the Image toolbar and the available tools, see Appendix B, Toolbars.
Figure 5: Image toolbar
Position and Size (F4) – opens the Position and Size dialog. See Chapter 3, Working with Objects for more information.
Align Objects – opens a sub-toolbar giving access to alignment tools for aligning selected objects in relation to each other. See Chapter 5, Combining Multiple Objects for more information.
Bring to Front (Shift+Ctrl++) – brings the selected object to the front of a group of objects.
Bring Forward (Ctrl++) – brings the selected object forward one step.
Send Backward (Ctrl+–) – sends the selected object one step backward.
Send to Back (Shift+Ctrl+–) – sends the selected object to the back of a group of objects.
In Front of Object – moves the selected object in front of another selected object.
Behind Object – moves the selected object behind another selected object.
Reverse – reverses the order of the selected objects. This tool is grayed out if only one object is selected.
Line Style – opens a drop-down list with different line styles used for the outline of the border. See Chapter 4, Changing Object Attributes for more information.
Line Width – used to change the width of a line. See Chapter 4, Changing Object Attributes for more information.
Line Color – used to change the color of a line. See Chapter 4, Changing Object Attributes for more information.
Area Style/Filling – used to change the type of filling used in a shape. See Chapter 4, Changing Object Attributes for more information.
Shadow – sets the default shadow effect around the picture. The shadow attributes are adjusted using the Shadow panel in the Properties deck on the Sidebar (Figure 6). See Chapter 4, Changing Object Attributes for more information.
Filter – opens the Image Filter toolbar which is described in “Image filters”.
Image Mode – changes the display of the graphic from color to grayscale, black and white, or a watermark. This setting affects only the display and printing of the picture; the original picture file remains unchanged. The image mode setting can also be changed using Color mode in the Image panel in the Properties deck on the Sidebar (Figure 6).
Default – the graphic is displayed unaltered in color.
Grayscale – the graphic is displayed in 256 shades of gray.
Black/White – the graphic is displayed in black and white.
Watermark – the color, brightness, contrast, and gamma settings are reduced so that the graphic can be used as a watermark (background). The default settings for Watermark can be adjusted using the Color toolbar (Figure 7).
Figure 6: Shadow and Image panels in Properties deck on Sidebar
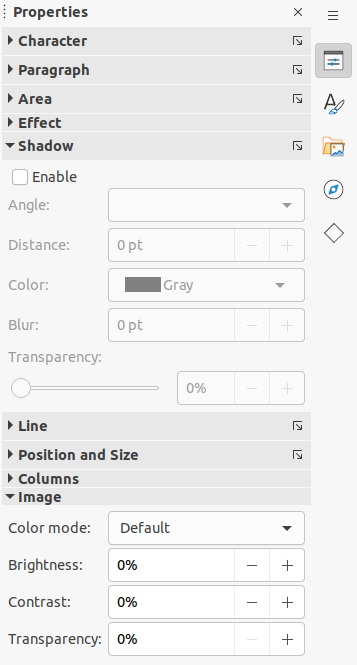
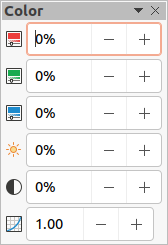
Figure 7: Color toolbar
Crop Image – crops or trims a picture. When using this tool, crop marks appear around the picture. Drag one or more of these marks to crop the picture to the desired size. For more information on cropping, see “Cropping images”.
Vertically – flips the selected object vertically. See Chapter 4, Changing Object Attributes for more information.
Horizontally – flips the selected object horizontally. See Chapter 4, Changing Object Attributes for more information.
Transformations – opens the Transformations toolbar. See Chapter 4, Changing Object Attributes for more information.
Transparency – adjusts the degree of transparency of the picture between 0% (opaque) and 100% (fully transparent). The transparency setting can also be adjusted using the Image section in the Properties deck on the Sidebar.
Color – opens the Color toolbar (Figure 7) to adjust the values of the RGB colors, brightness, contrast, and Gamma. These adjustments do not affect the original picture, but the values are stored in Draw as a separate formatting set. The color settings can also be adjusted using the Image section in the Properties deck on the Sidebar.
Red, Green, Blue – select values between –100% (no color) to +100% (full intensity); 0% represents the original color value of the graphic.
Brightness – select a value between –100% (totally black) and +100% (totally white).
Contrast – select a value between –100% (minimum) and +100% (maximum).
Gamma – this affects the brightness of the middle color tones. Select a value between 0.10 (minimum) to 10 (maximum) Try adjusting this value if changing brightness or contrast does not give the required result.
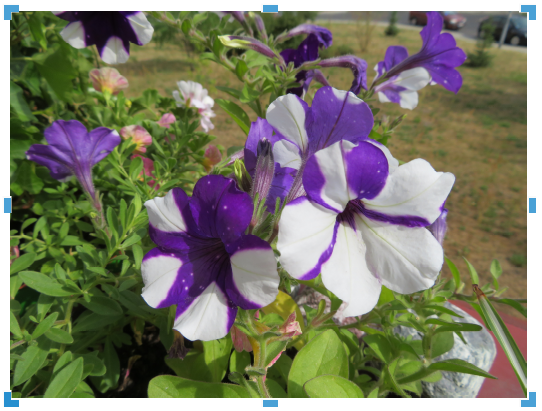
Cropping is a method of hiding unwanted areas of an image or changing the size of an image in a drawing. Changes made when cropping an image only change the display of the graphic in a drawing and not the original graphic file.
Figure 8: Example image ready for cropping with selection handles
After selecting a graphic, it can be cropped quickly using one of the following methods:
Click on Crop Image on the Standard or Image toolbar.
Go to Format > Image > Crop on the Menu bar.
Right-click on the image and select Crop from the context menu.
Selection handles appear around the selected image (Figure 8) and the image is cropped as follows:
Top, bottom, left, and right selection handles crop the image in one direction only.
Corner selection handles crop the image vertically and horizontally in two directions.
To maintain the ratio between vertical and horizontal dimensions, hold down the Shift key while moving a selection handle.
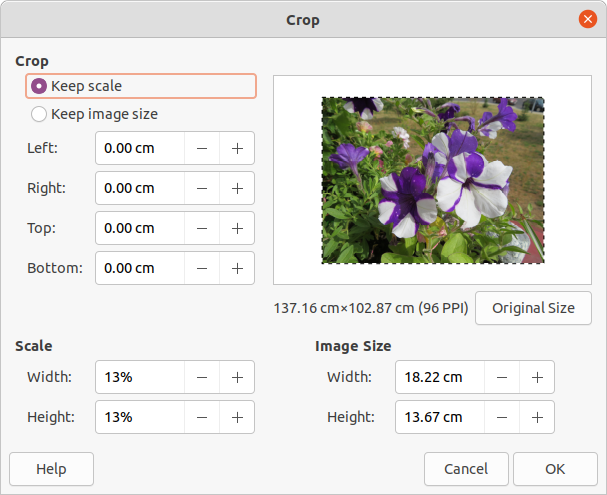
For more control and accuracy over the cropping functions, it is recommended to use the Crop dialog (Figure 9). After selecting an image, go to Format > Image > Crop Dialog on the Menu bar to open the Crop dialog.
Crop – use this section to trim or scale the selected graphic, or to add white space around the graphic.
Keep scale – maintains the original scale of the graphic when cropping so that only the size of the graphic changes.
Keep image size – maintains the original size of the graphic when cropping so that only the scale of the graphic changes. To reduce the scale of the graphic, select this option and enter negative values in the cropping boxes. To increase the scale of the graphic, enter positive values in the cropping boxes.
Figure 9: Crop dialog
Left and Right – if Keep scale is selected, enter a positive amount to trim the left or right edge of the graphic, or a negative amount to add white space to the left or right of the graphic. If Keep image size is selected, enter a positive amount to increase the horizontal scale of the graphic, or a negative amount to decrease the horizontal scale of the graphic.
Top and Bottom – if Keep scale is selected, enter a positive amount to trim the top or bottom of the graphic, or a negative amount to add white space above or below the graphic. If Keep image size is selected, enter a positive amount to increase the vertical scale of the graphic, or a negative amount to decrease the vertical scale of the graphic.
Scale – this section is used to change the scale of the selected graphic as it appears in a drawing.
Width – enter a percentage value to change the width of a selected graphic.
Height – enter a percentage value to change the height of a selected graphic.
Image Size – this section is used to change the size of the selected graphic.
Width – enter a value for the width of the selected graphic.
Height – enter a value for the height of the selected graphic.
Original Size – the original size of the graphic is displayed above the option. Clicking on this option and then clicking OK resets the selected graphic to its original size.
Note
In the Crop dialog, the Width and Height are treated as independent values. Changing one without the other can result in significant distortion of the image and this may not be what is required.
If a cropped graphic is to be used in another drawing, use one of the following methods after selecting the cropped graphic:
Go to File > Export on the Menu bar to open the Export dialog. Navigate to the destination folder, then enter a filename, choose the Selection option, and click on Export. See “Exporting graphics” for more information.
Go to Format > Image > Save on the Menu bar or right click on the cropped graphic and select Save from the context menu. Click on Yes to save the modified image and open an Image Export dialog. Select the file format required, navigate to the destination folder, then enter a filename and click on Save.
If a large image is inserted into a drawing and resized to fit into the layout of the drawing, the complete full-size original image is stored in the drawing file. This preserves its content, possibly resulting in a large file to store or send by mail.
If some loss of image quality can be accepted, the image can be compressed reducing its data volume while preserving its display in the page layout;
1) Open the Compress Image dialog (Figure 10) using one of the following methods:
Right-click on the image and select Compress from the context menu.
Go to Format > Image > Compress on the Menu bar.
Figure 10: Compress Image dialog
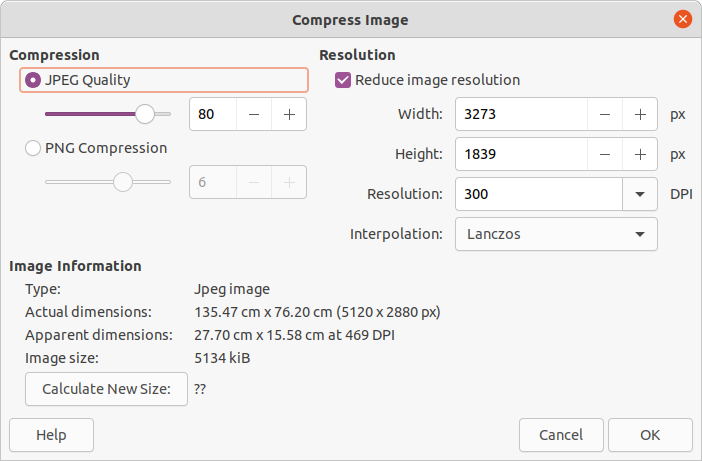
2) Select the type of compression and the resolution required.
3) Click on Calculate New Size to update the image information when the Compression and Resolution settings are changed.
4) When satisfied with the new settings, click OK to apply the settings.
5) If the resulting image is not acceptable, use the keyboard shortcut Ctrl+Z to undo the changes and select another compression setting.
Draw offers eleven filter effects that work on a selected graphic and they can be combined. Filters always apply to the entire graphic and it is not possible to use filters to edit only a part of the graphic.
1) Select a raster graphic to open the Image toolbar.
2) Apply an image filter using one of the following methods:
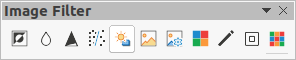
Click on Filter to open the Image Filter toolbar (Figure 11), then select an image filter to apply.
Go to Format > Image > Filter on the Menu bar and select an image filter from the context menu.
Note
If a graphic is embedded into a drawing, any image filters are applied directly to a selected graphic and the original graphic file is not changed. Save the drawing to retain any filter effects applied to the graphic in a drawing.
Figure 11: Image Filter toolbar
Note
After a drawing is saved and closed, the effects of image filters become permanent. If image filter effects are not satisfactory, use Edit > Undo on the Menu bar to cancel the filter effects before saving the drawing.
The image filters available for application to a raster graphic are as follows:
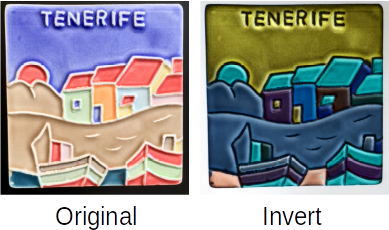
Invert – inverts or reverses the color values of a color image (similar to a color negative), or the brightness values of a grayscale image. Apply the filter again to revert to the original graphic (Figure 12).
Figure 12: Invert image filter
Smooth – softens or blurs the image by applying a low pass filter. This reduces the contrast between neighboring pixels and produces a lack of sharpness making the image appear smoother (Figure 13). The effect of the smooth filter can be very subtle. However, the following example shows the Smooth image filter applied at a Smooth radius setting of 50 making the image smooth, but blurred.
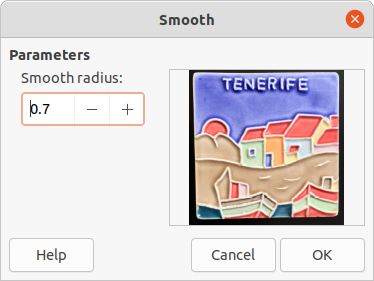
Selecting this filter opens the Smooth dialog (Figure 14) where the smooth radius parameter is set.
Figure 13: Smooth image filter
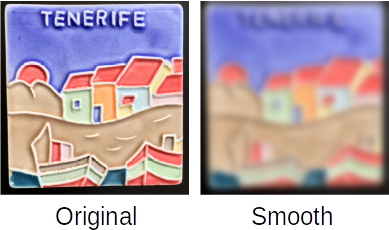
Figure 14: Smooth dialog
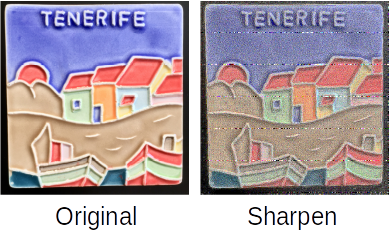
Sharpen – sharpens the image by applying a high pass filter, adjusting the contrast between neighboring pixels. The effect increases if the filter is applied several times making the colors appear faded, as shown by the example in Figure 15.
Figure 15: Sharpen image filter
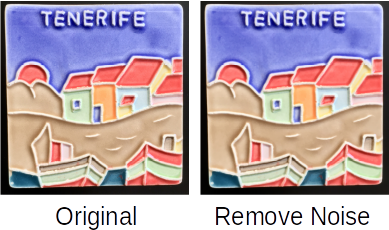
Remove Noise – removes noise by applying a median filter comparing every pixel with its neighbor. It then replaces any pixel with extreme values that deviate in color by a large amount from the mean value with a pixel that has a mean color value. The amount of picture information does not increase each time the filter is applied. However, there are fewer contrast changes resulting in an image that looks smoother and the effect is very subtle (Figure 16).
Figure 16: Remove Noise image filter
Solarization – solarization refers to an effect that looks like what can happen when there is too much light during photo development and the colors have become partly inverted. Dark areas appear light or light areas appear dark. In the digital world of photography, solarization creates a change or reversal of color (Figure 17), similar to the effect of the Invert image filter.
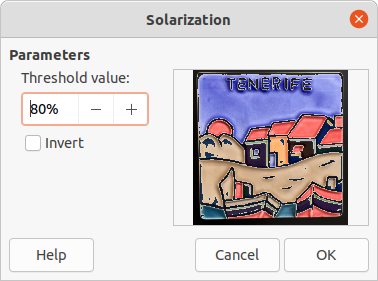
Selecting Solarization opens the Solarization dialog (Figure 18), where the degree of solarization (Threshold value) can be specified. Entering a value above 70% reverses the inversion effect on colors. Selecting Invert reverses the effect of the Solarization image filter.
Figure 17: Solarization image filter
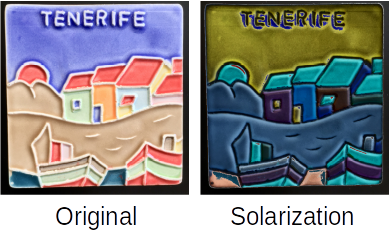
Figure 18: Solarization dialog
Aging – aging creates a look that resembles photographs developed in the early days of photography (Figure 19). All pixels are set to their gray values and then the green and blue color channels are reduced by the amount specified in Aging degree in the Aging dialog. Red color channel is not changed.
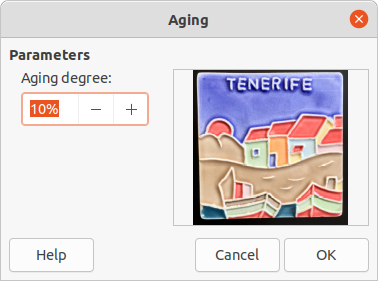
Selecting the Aging filter opens the Aging dialog (Figure 20), where the Aging degree can be defined and create an old look for the image.
Figure 19: Aging image filter
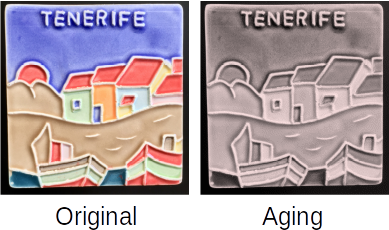
Figure 20: Aging dialog
Posterize – posterizing reduces the number of colors in an image. For example, a photograph will probably look like a painting when the number of colors is reduced (Figure 21).
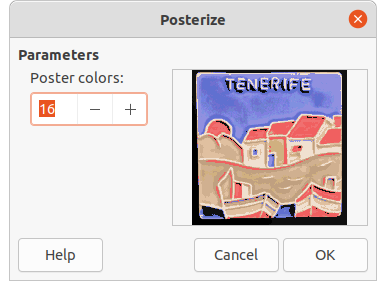
Selecting Posterize opens the Posterize dialog (Figure 22), where the number of poster colors can be defined to produce the effect required.
Figure 21: Posterize image filter
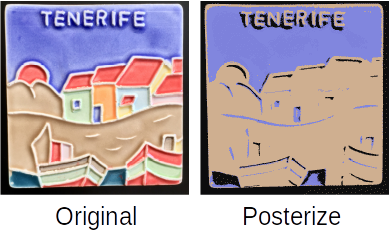
Figure 22: Posterize dialog
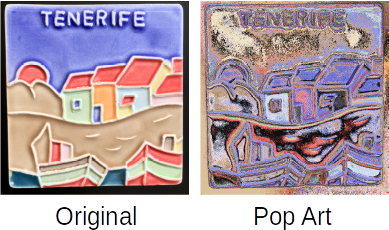
Pop Art – changes the colors of an image converting it to a pop-art format (Figure 23).
Figure 23: Pop Art image filter
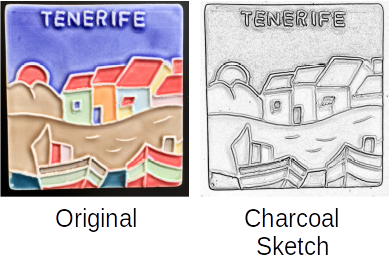
Charcoal Sketch – displays an image as a charcoal sketch. The contours of the image are drawn in black and the original colors are suppressed (Figure 24).
Figure 24: Charcoal Sketch image filter
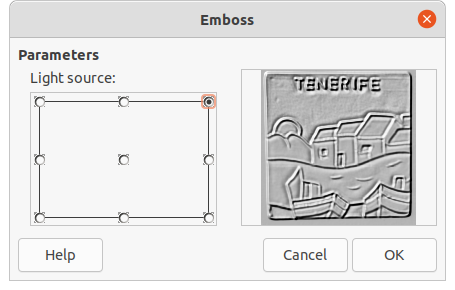
Relief – calculates the edges of an image in relief as if the image is illuminated by a light source (Figure 25). Selecting Relief opens the Emboss dialog (Figure 26) where the position of the Light source is selected producing shadows that differ in direction and magnitude.
Figure 25: Relief image filter
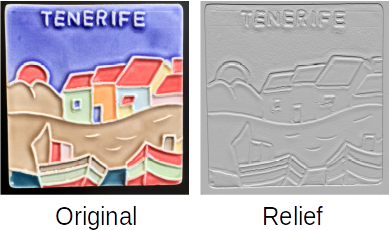
Figure 26: Emboss dialog
Mosaic – this image filter joins groups of pixels and converts them into rectangles of a single color creating an image that appears to be a mosaic (Figure 27). The larger the individual rectangles created, the fewer details in the mosaic graphic.
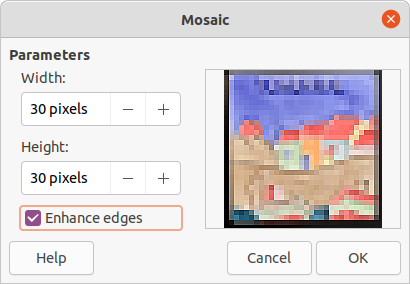
Selecting this image filter opens the Mosaic dialog (Figure 28), where the number of pixels for Width and Height of the tiles is set. Selecting Enhanced edges enhances the edges of each tile, creating a sharper definition.
Figure 27: Mosaic image filter
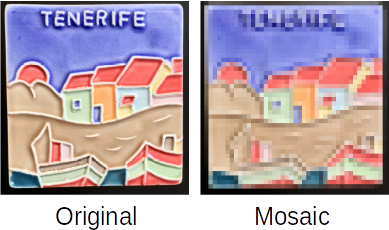
Figure 28: Mosaic dialog
The Color Replacer tool only allows replacement or changing a color in an embedded graphic for another color or set a color as transparent. Up to four colors can be replaced at once. An area of the graphic cannot be selected for editing as this tool only works on the entire graphic.
The selection of replacement colors can only be from one of the available palettes in LibreOffice. New colors cannot be defined here, but custom colors can be created before using the Color Replacer tool. For more information on creating colors, see Chapter 11, Advanced Draw Techniques.
Note
The Color Replacer can only be used on embedded graphics. If the Color Replacer is used on a linked graphic, the following error message appears “This image is linked to a document. Do you want to unlink the image in order to edit it?”. Click on Yes to unlink and embed the graphic.
Figure 29: Color Replacer dialog
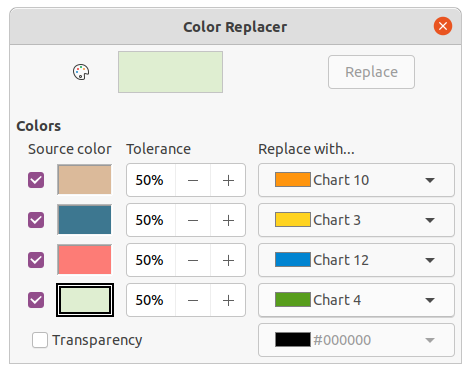
Pipette – switches color selection on when selected.
Replace – replaces the selected source colors in the selected image with the colors specified in the Replace with boxes.
Colors – lists the source colors and the replacement colors.
Source color checkbox – select this checkbox to replace the current Source color with the color that specified in the Replace with box.
Tolerance – set the tolerance for replacing a source color in the source image. To replace colors that are similar to the color selected, enter a low value. To replace a wider range of colors, enter a higher value.
Replace with – lists the available color palettes and replacement colors.
Transparency – replaces transparent areas in the selected image with the color selected.
1) Select an embedded image to start using the Color Replacer.
2) Go to Tools > Color Replacer on the Menu bar to open the Color Replacer dialog (Figure 29).
3) Click on Pipette at the top of the Color Replacer dialog to activate the color selection mode.
4) Move the cursor over the color to be replaced in the selected image and a preview of the color appears in the box next to Pipette.
5) Click on the color. The selected color appears in the first Source color preview box and a check mark appears next to it
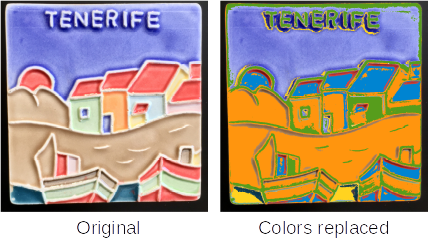
Figure 30: Example of using color replacer
6) To select another color, place a check mark next to the second Source color preview box and click on another color in the selected image. A maximum of four colors can be selected in the Color Replacer dialog.
7) Enter the amount of tolerance required for replacing each selected color in the Tolerance boxes. The default selection is 10% tolerance.
8) In Replace with, select a color palette from the drop-down list, then select the required color from the color palette. Transparent is the default selection.
9) After selecting up to four colors for replacement, click Replace to replace the colors in the selected graphic. An example of color replacement is shown in Figure 30.
10) There is no preview of the effect. If the result is not satisfactory, select Edit > Undo > Color Replacer in the Menu bar and repeat the color replacement.
Note
Using the Color Replacer replaces all occurrences of the Source color that are in the selected image.
Note
The default selection of Transparent in the Replace with boxes removes the selected color from the image and creates transparent areas in the selected image.
To replace any transparent areas in an image with a color use the following procedure:
1) Go to Tools > Color Replacer on the Menu bar to open the Color Replacer dialog.
2) Select an image with transparent areas.
3) Select Transparency in the Color Replacer dialog so that a check mark appears next to Transparency.
4) Select a color palette from the drop-down list next to Transparency, then select a color from the selected palette.
5) Click on Replace and the transparent areas are filled with the selected color.
6) There is no preview of the effect. If the result is incorrect, select Edit > Undo > Image Color Replacer in the Menu bar.
Contour conversion converts a selected object to a polygon, or a group of polygons, with four corner points. If an image was converted to a contour, then the converted image is set as a background graphic. If the conversion creates a group of polygons (for example, contour conversion of a text object), then enter the polygon group before selecting an individual polygon within the group. For more information on working with groups, see Chapter 5, Combining Multiple Objects.
After an object is converted to a contour, the object can no longer be edited normally. Instead, the contour converted object is edited using Edit > Points on the Menu bar to adjust its shape. For more information on editing points, see Chapter 3, Working with Objects.
Note
Any editing to an object must be completed before carrying out a contour conversion because any further editing is not possible on the converted object.
1) Carry out all necessary editing on the object before converting to a contour.
2) Make sure the object is selected.
3) Convert the object to a contour using one of the following methods:
Go to Shape > Convert > To Contour on the Menu bar.
Right-click on the selected object and select Convert > To Contour from the context menu.
Note
No confirmation dialog is provided for a contour conversion.
Polygon conversion is used to convert a selected image into a group of polygons filled with color. The image is also converted to a vector graphic and can be resized with no loss of image quality or distortion of any text.
After conversion, the graphic can be broken into groups of polygons and then split into individual polygons. Breaking and splitting allows editing or deletion of individual colors within the graphic.
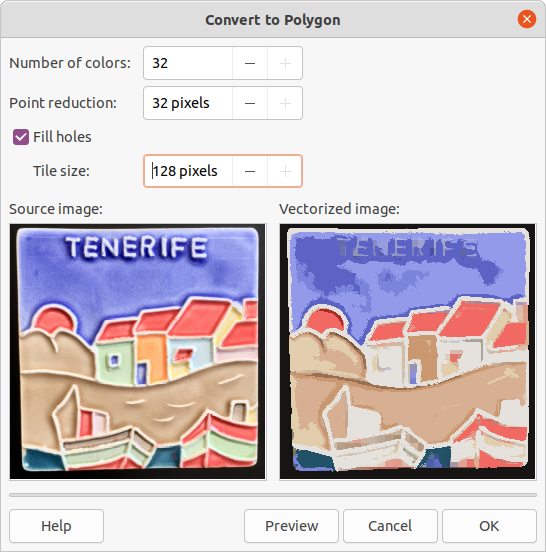
Number of colors – enter the number of colors to be displayed in the converted image. LibreOffice generates a polygon for each occurrence of a color in the image. The range for the number of colors is between 8 and 32.
Point reduction – removes color polygons that are smaller than the pixel value entered. The range for point reduction is between 0 and 32 pixels.
Fill holes – fills the blank areas in the graphic that can be created when applying a point reduction.
Tile size – enter the size of the rectangle for the background fill. The range of tile sizes is between 8 and 128 pixels.
Source image – preview of the original image.
Vectorized image – preview of the converted image.
Figure 31: Convert to Polygon dialog
Preview – creates a preview of the converted image in Vectorized image without applying any changes.
OK – converts the image to a vector graphic consisting of polygons. The result is a metafile in SVM format (StarView Metafile) used by LibreOffice and allows transfer of the converted image to other LibreOffice documents.
1) Select an image in a drawing.
2) Convert the image into a polygon using one of the following methods and open the Convert to Polygon dialog (Figure 31):
Go to Shape > Convert > To Polygon on the Menu bar.
Right-click on the image and select Convert > To Polygon from the context menu.
3) Select Number of colors and Point reduction to be used in the conversion.
4) Select Fill holes to prevent any blank areas appearing in the converted image.
5) Enter the number of pixels to use for Tile size.
6) Click Preview to check how the converted graphic will look.
7) Make any necessary changes to the settings and check the preview again.
8) If the converted image meets the expected requirements, click OK to convert the image to a polygon and close the Convert to Polygon dialog.
Note
No confirmation dialog is provided for a polygon conversion.
After converting an image to polygons, the vectorized image can be broken into groups of polygons. Each group of polygons consists of one color and becomes an object that can be used in another drawing.
1) Convert an image to polygons, see “Converting” above.
2) Make sure the converted image is selected, then use one of the following methods to break the image into groups of polygons:
Go to Shape > Break on the Menu bar.
Right-click on the image and select Break from the context menu.
3) Click on a color in the image and drag the group of polygons filled with that color out of the image to create a new image.
4) Alternatively, press Delete and delete the color from the image.
After converting an image to polygons and breaking the image into groups of polygons, these polygon groups can be split into individual polygons.
1) Convert an image to polygons, see “Converting” above.
2) Break the image into groups of polygons, see “Breaking” above.
3) Select the image, then use one of the following methods to split the groups of polygons into individual polygons:
Go to Shape > Split on the Menu bar.
Right-click on the image and select Shapes > Split from the context menu.
Use the keyboard shortcut Ctrl+Alt+Shift+K.
4) Select an individual polygon (or several polygons) in the image and drag the polygon from the image to create a new image in the drawing.
5) Alternatively, press Delete to delete the selected polygon(s) from the image.
All drawing objects placed into a LibreOffice drawing are vector graphics and these vector graphics can be converted to a bitmap (raster graphic) in PNG format. Any transparency effects in the original vector graphic are lost during conversion even though the PNG format used by LibreOffice Draw supports transparencies.
Use one of the following methods to convert a vector graphic to a bitmap:
Go to Shape > Convert > To Bitmap on the Menu bar.
Right-click on the graphic and select Convert > To Bitmap from the context menu.
Note
No confirmation dialog is provided for a bitmap conversion.