
Draw Guide 7.5
Chapter 6,
Editing Images
Raster Graphics
This document is Copyright © 2023 by the LibreOffice Documentation Team. Contributors are listed below. This document maybe distributed and/or modified under the terms of either the GNU General Public License (https://www.gnu.org/licenses/gpl.html), version 3 or later, or the Creative Commons Attribution License (https://creativecommons.org/licenses/by/4.0/), version 4.0 or later. All trademarks within this guide belong to their legitimate owners.
Contributors for this edition:
Peter Schofield
Contributors for previous editions:
Claire Wood
Elzett Kotze
Jean Hollis Weber
John A Smith
John Cleland
Kees Kriek
Martin Fox
Peter Schofield
Regina Henschel
Please direct any comments or suggestions about this document to the Documentation Team mailing list: loguides@community.documentfoundation.org.
Note
Everything sent to a mailing list, including email addresses and any other personal information that is written in the message, is publicly archived and cannot be deleted.
Published July 2023. Based on LibreOffice 7.5 Community.
Other versions of LibreOffice may differ in appearance and functionality.
Some keystrokes and menu items are different on macOS from those used in Windows and Linux. The table below gives some common substitutions used in this document. For a detailed list, see LibreOffice Help.
|
Windows or Linux |
macOS equivalent |
Effect |
|
Tools > Options |
LibreOffice > Preferences |
Access setup options |
|
Right-click |
Control+click, Ctrl+click, or right-click depending on computer setup |
Open a context menu |
|
Ctrl or Control |
⌘ and/or Cmd or Command, depending on keyboard |
|
|
Alt |
⌥ and/or Alt or Option depending on keyboard |
Used with other keys |
|
F11 |
⌘+T |
Open the Styles deck in the Sidebar |
Previous chapters in this Draw Guide have dealt only with vector graphics and the most common types of vector graphics in use are as follows:
SVG (Scalable Vector Graphics)
EPS (Encapsulated PostScript)
AI (Adobe Illustrator)
Draw also contains a number of functions for handling raster graphics or bitmaps such as photographs and scanned pictures, including import, export, and conversion from one format to another.
Draw can read the majority of graphic file formats using a subset of capabilities similar to raster graphics programs like Gimp or Adobe Photoshop. Raster graphics are generally images or pictures that use the most common formats in use:
JPG/JPEG (Joint Photographic Experts Group)
GIF (Graphics Interchange Format)
PNG (Portable Network Graphics)
TIF/TIFF (Tagged Image File Format)
BMP (BitMaP)
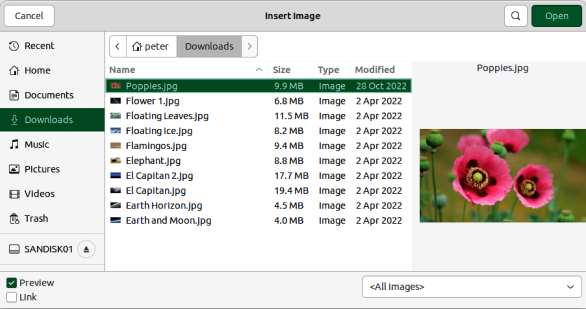
To import image files into a drawing, go to Insert > Image on the Menu bar to open the Insert Image dialog (Figure 1).
Draw contains import filters for the majority of graphic formats. If the file being imported uses a graphic format not covered by the import filters, it is recommended to use one of the many free graphic conversion programs to convert the file into a format that Draw recognizes.
If Preview is selected, a preview of the file is shown on the right-hand side of the Insert Image dialog. This makes it easier to select the file required and also checks that Draw can import the file format used.
Figure 1: Insert Image dialog
Embedding a graphic into a drawing makes it a permanent part of the drawing. Any changes made to an embedded graphic only appear in the drawing where the graphic has been embedded. The original graphic file is not affected. Embedding happens when a graphic is imported into a drawing using one of the following methods:
Insert Image dialog.
Copying and pasting.
Scanning a graphic.
Dragging and dropping between open files.
The main advantage of embedding graphics into a drawing is that the graphic is always available no matter what computer is used to open the drawing.
The main disadvantage of embedding graphics is that it creates large file sizes, which may not be desirable if there is limited storage capacity on a computer. Also, if the original graphic is altered, then the embedded graphic is not updated each time the drawing is opened.
Note
When a graphic is embedded into a LibreOffice drawing, make sure that Insert as Link is not selected in the Insert Image dialog.
Linking to the original graphic does not insert the graphic into a drawing, but creates a link to where the original graphic file is located. Each time the drawing is opened, any linked graphics are displayed in the drawing.
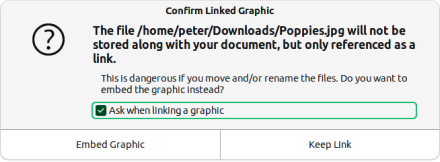
Figure 2: Confirm Linked Graphic dialog
The main advantage of linking a graphic file when inserted into a drawing is that if the original graphic file is altered or replaced with a graphic using the same filename, the version of the graphic in the drawing is always up to date. The next time the drawing is opened, the latest version of the graphic is also opened in the drawing. Also the file size of the drawing is much smaller and the original graphic is easily edited with specialized external applications.
The main disadvantage of linking graphics is that the link must be maintained between the drawing and the embedded graphic file for linking to work correctly. If the original drawing or graphic file is moved to another computer location, then any links must be updated to include the new location.
1) Open the Insert Image dialog.
2) Select Insert as Link in the Insert Image dialog.
3) Select the required graphic file and click on Open to open the Confirm Linked Graphic dialog (Figure 2).
4) Click on Keep Link to link the file and close the Confirm Linked Graphic dialog.
5) If necessary, click on Embed Graphic to embed the file instead of linking the file. This also closes the Confirm Linked Graphic dialog.
Note
When a graphic file is linked to a LibreOffice drawing, the format of the linked graphic is not changed.
Links can be updated, modified, or broken as follows:
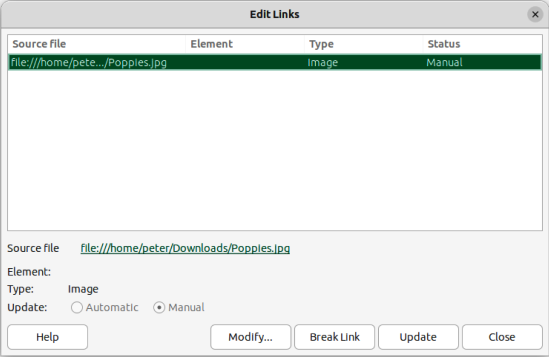
1) Go to Edit > External Links on the Menu bar to open the Edit Links dialog (Figure 3) and select the link to be edited.
2) Click on Modify, Break Link, or Update as appropriate.
Modify — changes the graphic file in the drawing and the source file for the selected link.
Break Link — breaks the link between the selected file and the current document. The version of the graphic file in the drawing becomes embedded into the drawing. A confirmation dialog opens asking if the link is to be broken. Click on Yes to confirm the breaking of the link.
Update — updates the selected link so that the most recent version of the linked file is displayed in the drawing.
3) Click on Close to save the changes to the link and close the Edit Links dialog.
Figure 3: Edit Links dialog
After scanning, the scanned images are inserted and embedded using PNG format into a drawing or document. To insert scanned images, make sure the scanner is configured for the computer and supported by the following systems:
SANE for a Linux operating system.
TWAIN for a Windows or Mac operating system.
The following procedure is an example only. The actual scanning procedure depends on the scanner driver, interface, and computer operating system. Consult the scanner documentation for more information.
1) Place a document, drawing, or photograph in the scanner and make sure that the scanner is switched on and ready.
2) If this is the first time the scanner has been used with LibreOffice, go to Insert > Media > Scan > Select Source on the Menu bar to select the scanner.
3) If the scanner has been used before, go to Insert > Image > Scan > Request on the Menu bar.
4) Specify the scanning resolution, subject being scanned, and so on.
5) When the image has been scanned, Draw places it in the drawing. At this point the scanned image can be edited like any other graphic.
Note
If more than one scanning device is connected to the computer, the device is selected when the source is selected. This selection becomes the default source for scanning until another scanner is selected and used as the scanning source.
Copying and pasting a graphic also embeds a graphic file into a drawing. A copied graphic can be an image already embedded in another document or drawing, or it can be a graphic file such as a drawing, document, or photograph.
1) After copying the graphic file, go to Edit > Paste Special > Paste Special on the Menu bar to open the Paste Special dialog.
2) Select the required format for pasting the copied graphic into a drawing. Available formats for pasting depend on the type of file copied onto the clipboard.
3) Click OK to paste the graphic file and close the Paste Special dialog.
Note
When copying and pasting images into a drawing, please respect the copyright and license of any file being copied.
By default Draw saves drawings in the Open Document format ODG and some software programs are not compatible with this format. To make drawings available for other programs, a file can be exported in various formats. The export procedure used depends on the computer setup and computer operating system being used. The following procedure is an example export procedure.
1) Open the ODG file being exported.
Figure 4: Example of an export dialog
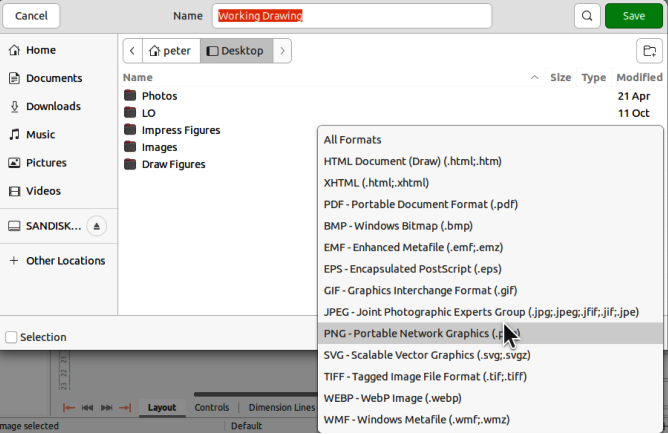
2) Go to File > Export on the Menu bar and open the Export dialog. An example of an export dialog is shown in Figure 4.
3) Enter a new filename for the exported file and navigate to the folder where the exported file is to be saved.
4) Select the required file format from the options in the drop-down list.
5) Click Export and the file is exported as a new file in the selected file format.
6) Depending on the file format selected, another dialog may open allowing options to be selected for the export format.
7) Depending on the additional dialog that may open, click on Export, Create, or OK and the file is exported as a new file in its new format.
Exporting individual objects, or a group of objects, from a drawing file is similar to “Exporting files” above. Open a drawing and select the object or objects for export. Make sure to choose the Selection option in the export dialog, as shown in Figure 4. Using this method, an imported image can be modified, annotations added to it, and make any other changes, then select it and export for use in another drawing or document.
Images (raster graphics) are edited and formatted to add or change filters and adjust the properties of color, lines, areas, and shadows using one of the following methods:
Go to Format > Image on the Menu bar and use the tools in the sub-menu that opens.
Use the tools on the Image toolbar (Figure 5). See “Image toolbar” below for more information.
Use the tools available in the Image panel on the Properties deck of the Sidebar.
Some raster graphics may have a text element. For more information on formatting text, see Chapter 9, Adding and Formatting Text.
Notes
Formatting changes made to a graphic using the tools in LibreOffice only appear in the drawing where the graphic was modified. Original graphic file is not affected.
Raster graphics included in a group behave like other objects when the properties of the group are edited and formatted.
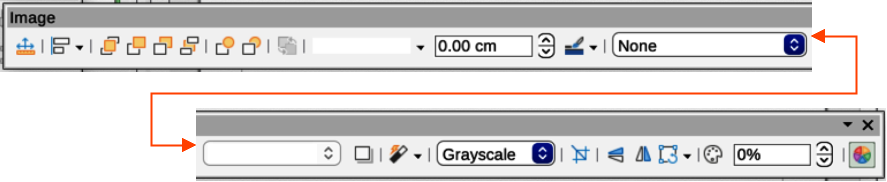
Figure 5: Image toolbar
Draw names objects, including inserted images, Shape 1, Shape 2, and so on, using the insertion order into a drawing. It is recommended to rename objects, including images, using a unique name. Names make objects and images easily identifiable in the LibreOffice Navigator.
1) Select an image, then use one of the following methods to open the Name dialog and create a unique name for the selected image:
Go to Format > Name on the Menu bar.
Right-click on the image and select Name from the context menu.
2) Enter a name in the Name text box in the Name dialog that opens and click OK.
The Image toolbar (Figure 5) appears when an image or object that is a raster graphic is selected. For more information on the Image toolbar and the available tools, see Appendix B, Toolbars. The tools listed below for the Image toolbar are an example only.
Position and Size (F4)
Align Objects
Bring to Front
Bring Forward
Send Backward
Send to Back
In Front of Object
Behind Object
Reverse
Line Style
Line Width
Line Color
Area Style/Filling
Shadow
Filter
Image Mode
Default
Image is displayed unaltered in color.
Grayscale
Image is displayed in 256 shades of gray.
Black/White
Image is displayed in black and white.
Figure 6: Image panel in Properties deck on Sidebar
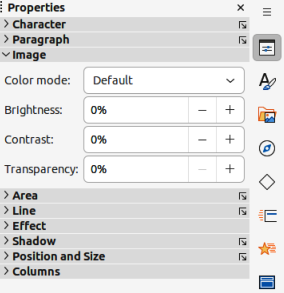
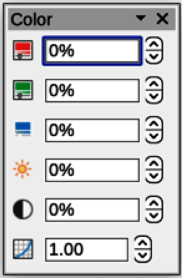
Figure 7: Color sub-toolbar
Watermark
Color, brightness, contrast, and gamma settings are reduced so that the image can be used as a watermark (background). The default settings for Watermark can be adjusted using the Color sub-toolbar (Figure 7).
Crop Image
Vertically
Horizontally
Transformations
Transparency
Color
Red, Green, Blue
Select values between –100% (no color) to +100% (full intensity); 0% represents the original color value of the image.
Brightness
Select a value between –100% (totally black) and +100% (totally white).
Contrast
Select a value between –100% (minimum) and +100% (maximum).
Gamma
Affects the brightness of the middle color tones. Select a value between 0.10 (minimum) to 10 (maximum) Try adjusting this value if changing brightness or contrast does not give the required result.
Cropping is a method of hiding unwanted areas of an image or changing the size of an image in a drawing. Changes made when cropping an image only change the display of the image in a drawing and not the original image file.
After selecting an image, it can be cropped quickly using one of the following methods:
Click on Crop Image on the Standard or Image toolbar.
Go to Format > Image > Crop on the Menu bar.
Right-click on the image and select Crop from the context menu.
Selection handles appear around the selected image (Figure 8) and the image is cropped as follows:
Top, bottom, left, and right selection handles crop the image in one direction only.
Corner selection handles crop the image vertically and horizontally in two directions.
To maintain the ratio between vertical and horizontal dimensions, hold down the Shift key while moving a selection handle.
For more control and accuracy over the cropping functions, it is recommended to use the Crop dialog (Figure 9). Select an image and go to Format > Image > Crop Dialog on the Menu bar to open the Crop dialog.
Figure 8: Example image in crop mode
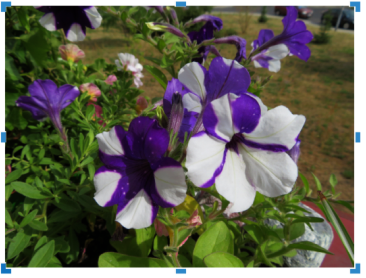
Figure 9: Crop dialog
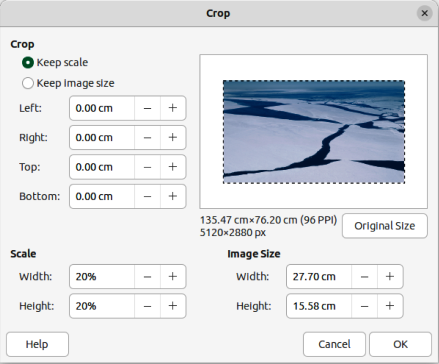
Crop
Keep scale
Maintains the original scale of the image when cropping so that only the size of the image changes.
Keep image size
Maintains the image original size when cropping so that only the image scale changes. To reduce the image scale, select this option and enter negative values in the cropping boxes. To increase the image scale, enter positive values in the cropping boxes.
Left and Right
If Keep scale is selected, enter a positive amount to trim the left or right edge of the image, or a negative amount to add white space to the left or right of the image. If Keep image size is selected, enter a positive amount to increase the image horizontal scale, or a negative amount to decrease the image horizontal scale.
Top and Bottom
If Keep scale is selected, enter a positive amount to trim the image top or bottom, or a negative amount to add white space above or below the image. If Keep image size is selected, enter a positive amount to increase the image vertical scale, or a negative amount to decrease the image vertical scale.
Scale
Width
Enter a percentage value to change the image width.
Height
Enter a percentage value to change the image height.
Image Size
Width
Enter a value for the image width.
Height
Enter a value for the image height.
Original Size
Note
In the Crop dialog, the Width and Height are treated as independent values. Changing one without the other can result in significant distortion of the image and this may not be what is required.
If a cropped image is to be used in another drawing, use one of the following methods after selecting the cropped image:
Go to File > Export on the Menu bar to open the Export dialog. Navigate to the destination folder, then enter a filename, choose the Selection option, and click on Export. See “Exporting images” on page 1 for more information.
Go to Format > Image > Save on the Menu bar or right click on the cropped image and select Save from the context menu. Click on Yes to save the modified image and open an Image Export dialog. Select the file format required, navigate to the destination folder, then enter a filename and click on Save.
If a large image is inserted into a drawing and resized to fit into the layout of the drawing, the complete full-size original image is stored in the drawing file. This preserves the original image, possibly resulting in a large file to store or send by mail.
If some loss of image quality can be accepted, the image can be compressed reducing its data volume while preserving its display in the page layout;
1) Open the Compress Image dialog (Figure 10) using one of the following methods:
Right-click on the image and select Compress from the context menu.
Go to Format > Image > Compress on the Menu bar.
2) Select the type of compression and the resolution required.
3) Click on Calculate New Size to update the image information when the Compression and Resolution settings are changed.
4) When satisfied with the new settings, click OK to apply the settings.
5) If the resulting image is not acceptable, use one of the following methods to undo the changes and select another compression setting.
Keyboard shortcut Ctrl+Z (macOS ⌘+Z).
Go to Edit > Undo on the Menu bar.
Figure 10: Compress Image dialog
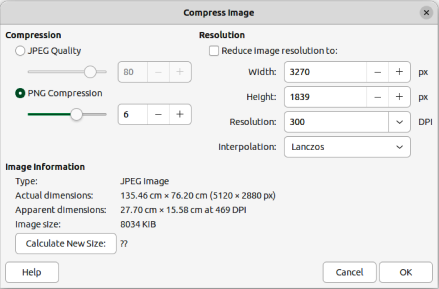
Figure 11: Image Filter sub-toolbar
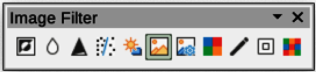
Draw has eleven filter effects that work on selected images and these filters can be combined. Filters always apply to the entire image and it is not possible to use filters to edit only a part of the image.
1) Select an image to open the Image toolbar.
2) Apply an image filter using one of the following methods:
Click on Filter to open the Image Filter sub-toolbar (Figure 11), then select an image filter to apply.
Go to Format > Image > Filter on the Menu bar and select an image filter from the context menu.
Notes
If an image is embedded into a drawing, any image filters are applied directly to the embedded image and the original image file is not changed. Save the drawing to retain any filter effects applied to the embedded image in a drawing.
After a drawing is saved and closed, the effects of image filters become permanent. If image filter effects are not satisfactory, use Edit > Undo on the Menu bar to cancel the filter effects before saving the drawing.
When applying image filters to an image, the file size of the image must be taken into account. On large file sizes, there is a time lag between applying an image filter and the effect to be visible on the image.
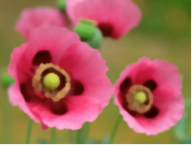
Figure 12: Example image — no filter
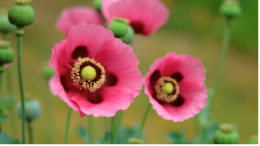
Figure 12 is an example of an image with no image filters applied. The image filters available on the Image Filter sub-toolbar are as follows with examples of the filter effect on the image.
Invert
Figure 13: Example of Invert filter
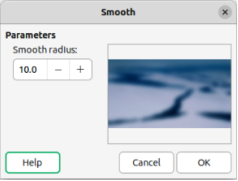
Smooth
Figure 14: Example of Smooth filter

Figure 15: Smooth dialog
Sharpen
Figure 16: Example of Sharpen filter
Remove Noise
Figure 17: Example of Remove Noise filter
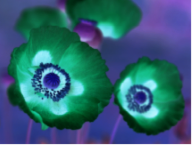
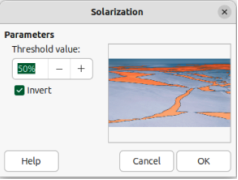
Solarization
Figure 18: Example of Solarization filter
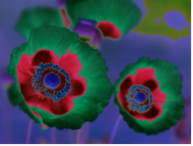
Figure 19: Solarization dialog
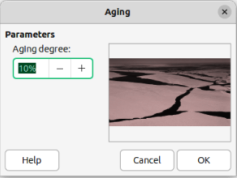
Aging
Figure 20: Example of Aging filter
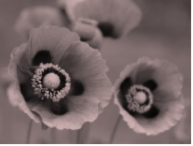
Figure 21: Aging dialog
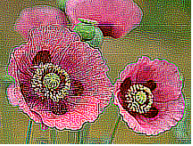
Posterize
Figure 22: Example of Posterize filter
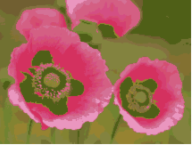
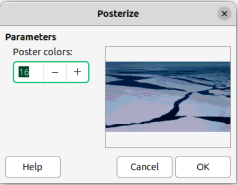
Figure 23: Posterize dialog
Pop Art
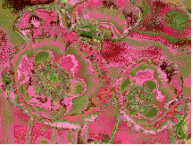
Figure 24: Example of Pop Art filter
Charcoal Sketch
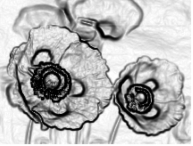
Figure 25: Example of Charcoal Sketch filter
Relief
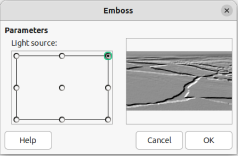
Figure 26: Example of Relief filter
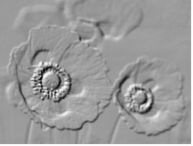
Figure 27: Emboss dialog
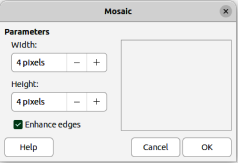
Mosaic
Figure 28: Example of Mosaic filter
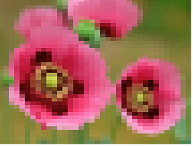
Figure 29: Mosaic dialog
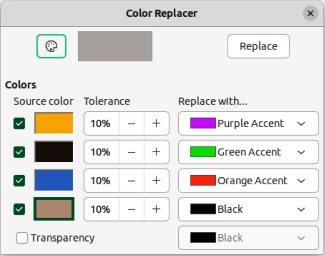
The Color Replacer allows replacement or changing a color in an embedded graphic for another color, or set a color as transparent. Up to four colors can be replaced at once. An area of the graphic cannot be selected for editing as this tool only works on the entire graphic.
The replacement colors selection can only be from one of the available palettes in LibreOffice. New colors cannot be defined here, but custom colors can be created before using the Color Replacer. For more information on creating colors, see Chapter 11, Advanced Draw Techniques.
Note
The Color Replacer can only be used on embedded graphics. If the Color Replacer is used on a linked graphic, the following error message appears “This image is linked to a document. Do you want to unlink the image in order to edit it?”. Click on Yes to unlink and embed the graphic.
Pipette
Replace
Colors
Source color
Select this checkbox to replace the current Source color with the color that specified in the Replace with box.
Tolerance
Set the tolerance for replacing a source color in the source image. To replace colors that are similar to the color selected, enter a low value. To replace a wider range of colors, enter a higher value.
Replace with
Lists the available color palettes and replacement colors.
Figure 30: Color Replacer dialog
Transparency
1) Select an embedded image to start using the Color Replacer.
2) Go to Tools > Color Replacer on the Menu bar to open the Color Replacer dialog (Figure 30).
3) Click on Pipette at the top of the Color Replacer dialog to activate the color selection mode.
4) Move the cursor over the color to be replaced in the selected image and a preview of the color appears in the box next to Pipette.
5) Click on the color. The selected color appears in the first Source color preview box and a check mark appears next to it.
6) To select another color, place a check mark next to the second Source color preview box and click on another color in the selected image. A maximum of four colors can be selected in the Color Replacer dialog.
7) Enter the amount of tolerance required for replacing each selected color in the Tolerance boxes. The default selection is 10% tolerance.
8) In Replace with, select a color palette from the drop-down list, then select the required color from the color palette. Transparent is the default selection.
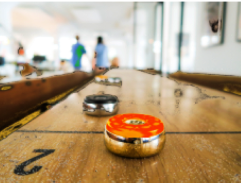
9) After selecting up to four colors for replacement, click Replace to replace the colors in the selected graphic. Examples of the original image and after image color replacement are shown in Figures 31 and 32.
Figure 31: Example image before replacing colors
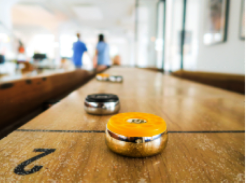
Figure 32: Example image after replacing colors
10) There is no preview of the effect. If the result is not satisfactory, select Edit > Undo > Color Replacer in the Menu bar and repeat the color replacement.
Notes
Using the Color Replacer replaces all occurrences of the Source color that are in the selected image.
The default selection of Transparent in the Replace with boxes removes the selected color from the image and creates transparent areas in the selected image.
To replace any transparent areas in an image with a color use the following procedure:
1) Go to Tools > Color Replacer on the Menu bar to open the Color Replacer dialog.
2) Select an image with transparent areas.
3) Select Transparency in the Color Replacer dialog so that a check mark appears next to Transparency.
4) Select a color palette from the drop-down list next to Transparency, then select a color from the selected palette.
5) Click on Replace and the transparent areas are filled with the selected color.
6) There is no preview of the effect. If the result is incorrect, select Edit > Undo > Image Color Replacer in the Menu bar.
Contour conversion converts a selected object to a polygon, or a group of polygons, with four corner points.
Converting an image to a contour, the converted image is set as a background graphic.
If the conversion creates a group of polygons (for example, contour conversion of a text object). Enter the polygon group before selecting an individual polygon within the group. For more information on working with groups, see Chapter 5, Combining Multiple Objects.
After converting an image to a contour, the object can no longer be edited normally. The converted image has to be edited using Edit > Points on the Menu bar to adjust its shape. For more information on editing points, see Chapter 3, Working with Objects.
Notes
Any editing to an object must be completed before carrying out a contour conversion because any further normal editing is not possible on the converted object.
No confirmation dialog is provided for a contour conversion.
1) Carry out all necessary editing on the object before converting to a contour.
2) Make sure the object is selected.
3) Convert the object to a contour using one of the following methods:
Go to Shape > Convert > To Contour on the Menu bar.
Right-click on the selected object and select Convert > To Contour from the context menu.
Polygon conversion is used to convert a selected image into a group of polygons filled with color. The image is also converted to a vector graphic and can be resized with no loss of image quality or distortion of any text. After conversion, the graphic can be broken into groups of polygons and then split into individual polygons. Breaking and splitting allows editing or deletion of individual colors within the graphic.
Number of colors
Point reduction
Fill holes
Tile size
Source image
Vectorized image
Preview
OK
1) Select an image in a drawing.
2) Convert the image into a polygon using one of the following methods and open the Convert to Polygon dialog (Figure 33).
Go to Shape > Convert > To Polygon on the Menu bar.
Right-click on the image and select Convert > To Polygon from the context menu.
3) Select Number of colors and Point reduction to be used in the conversion.
4) Select Fill holes to prevent any blank areas appearing in the converted image.
Figure 33: Convert to Polygon dialog
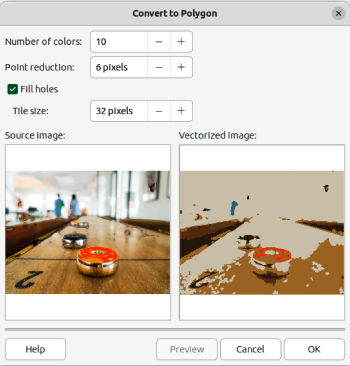
5) Enter the number of pixels to use for Tile size.
6) Click Preview to check how the converted graphic will look.
7) Make any necessary changes to the settings and check the preview again.
8) If the converted image meets the expected requirements, click OK to convert the image to a polygon and close the Convert to Polygon dialog.
After converting an image to polygons, the vectorized image can be broken into groups of polygons. Each group of polygons consists of one color and becomes an object that can be used in another drawing.
1) Convert an image to polygons, see “Converting” above.
2) Make sure the converted image is selected, then use one of the following methods to break the image into groups of polygons:
Go to Shape > Break on the Menu bar.
Right-click on the image and select Break from the context menu.
3) Click on a color in the image and drag the group of polygons filled with that color out of the image to create a new image.
4) Alternatively, press Delete and delete the color from the image.
After converting an image to polygons and breaking the image into polygon groups, these polygon groups can be split into individual polygons.
1) Convert an image to polygons, see “Converting” above.
2) Break the image into groups of polygons, see “Breaking” above.
3) Select the image, then use one of the following methods to split the polygon groups into individual polygons:
Go to Shape > Split on the Menu bar.
Right-click on the image and select Shapes > Split from the context menu.
Use the keyboard shortcut Ctrl+Alt+Shift+K (macOS ⌘+⌥+Shift+K)
4) Select an individual polygon (or several polygons) in the image and drag the polygon from the image to create a new image in the drawing.
5) Alternatively, press Delete to delete the selected polygon(s) from the image.
All drawing objects placed into a LibreOffice drawing are vector graphics and these vector graphics can be converted to a bitmap (raster graphic) in PNG format. Any transparency effects in the original vector graphic are lost during conversion even though the PNG format used by LibreOffice Draw supports transparencies. Use one of the following methods to convert a vector graphic to a bitmap. There is no confirmation dialog is provided for a bitmap conversion.
Go to Shape > Convert > To Bitmap on the Menu bar.
Right-click on the graphic and select Convert > To Bitmap from the context menu.