Getting Started Guide 25.2
This document is Copyright © 2025 by the LibreOffice Documentation Team. Contributors are listed below. This document may be distributed and/or modified under the terms of either the GNU General Public License (https://www.gnu.org/licenses/gpl.html), version 3 or later, or the Creative Commons Attribution License (https://creativecommons.org/licenses/by/4.0/), version 4.0 or later. All trademarks within this guide belong to their legitimate owners.
To this edition
Claire Wood
Edward Olson
Peter Schofield
For previous editions
B Antonio Fernandez
Claire Wood
Dave Barton
Hazel Russman
Kees Kriek
Nay Catina Dia-Schneebeli
Olivier Hallot
Peter Schofield
Ron Faile Jr.
Skip Masonsmith.
Please direct any comments or suggestions about this document to the Documentation Team Forum at https://community.documentfoundation.org/c/documentation/loguides/ (registration is required) or send an email to: loguides@community.documentfoundation.org.
Note
Everything sent to a forum, including email addresses and any other personal information that is written in the message, is publicly archived and cannot be deleted. Emails sent to the forum are moderated.
Published July 2025. Based on LibreOffice 25.2 Community.
Other versions of LibreOffice may differ in appearance and functionality.
Some keystrokes and menu items are different on macOS from those used in Windows and Linux. The table below gives some common substitutions used in this document. For a detailed list, see LibreOffice Help.
|
Windows or Linux |
macOS equivalent |
Effect |
|
Tools > Options |
LibreOffice > Preferences |
Access setup options |
|
Right-click |
Control+click, Ctrl+click, or right click depending on computer setup |
Open a context menu |
|
Ctrl or Control |
⌘ and/or Cmd or Command, depending on keyboard |
|
|
Alt |
⌥ and/or Alt or Option depending on keyboard |
Used with other keys |
|
F11 |
⌘+T |
Open the Styles deck in the Sidebar |
LibreOffice Draw is the vector graphics drawing module included with the LibreOffice suite. It can be used to create a wide variety of graphic images, including some operations on raster graphics.
Vector graphics store and display an image as an assembly of simple geometric elements such as lines, circles, and polygons, rather than a collection of pixels (points on the screen). Vector graphics allow for easier storage and image scaling.
Draw is fully integrated into the LibreOffice suite simplifying exchanging graphics between all LibreOffice modules. If an image is created in Draw, reusing it in a Writer document is relatively easy. For example, select and copy a drawing in Draw, then paste the copied image directly into a Writer document. Also, drawings can be worked on directly from within Writer or Impress, using a subset of functions and tools from Draw.
The functionality of Draw is extensive, but has not been designed to rival high-end graphics applications. However, Draw has more functionality than drawing tools that are available in the majority of office productivity suites. A few examples of drawing functions are as follows:
Layer management
Magnetic grid-point system
Dimensions and measurement display
Connectors for making organization charts and other diagrams
3D functions for creating small three-dimensional drawings
Drawing and page-style integration
Bézier curves
This chapter introduces some features of Draw, but does not cover all the available features in Draw. See the Draw Guide and LibreOffice Help for more information.
Notes
When LibreOffice is installed on a computer, a menu entry for each module is added to the system menu. The exact name and location of these menu entries depends on the operating system and graphical user interface being used.
The New icon displayed on the Standard toolbar depends on which LibreOffice module is open when creating a new document, presentation, spreadsheet, or drawing.
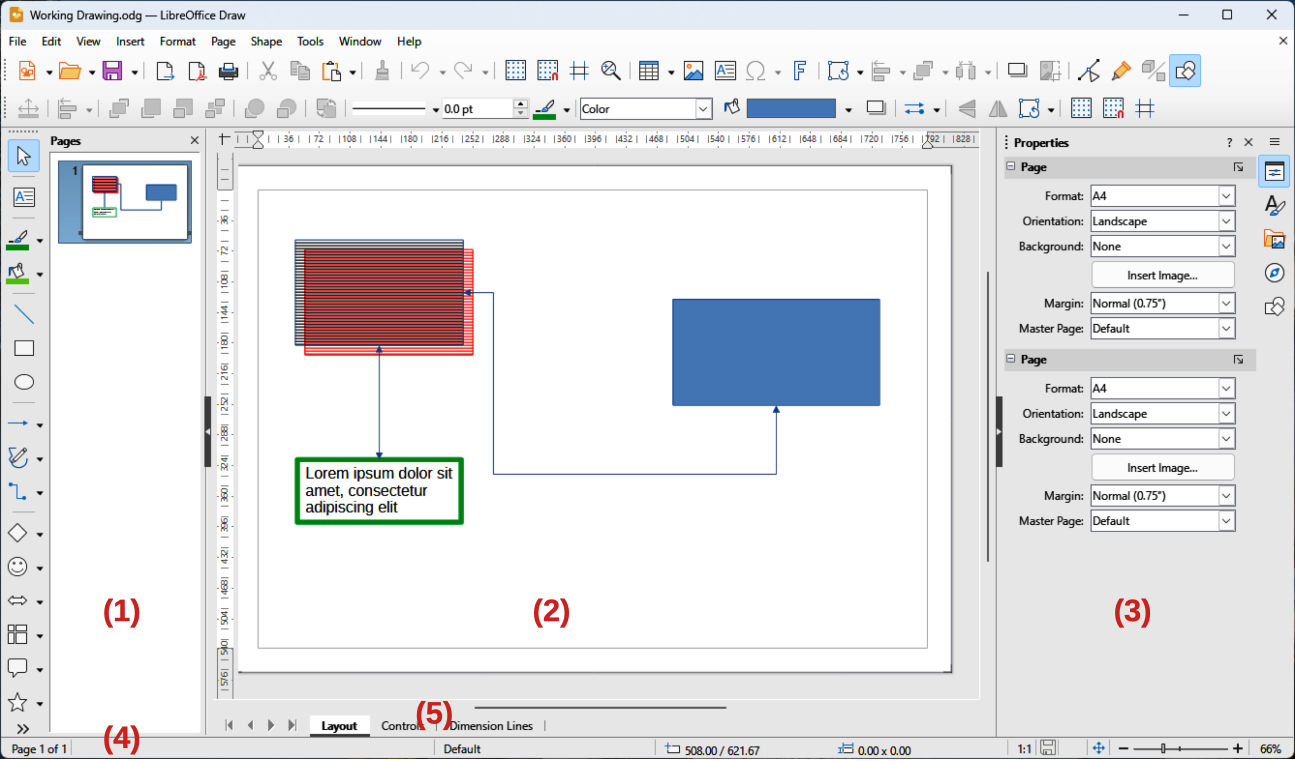
In Draw, drawings can be split over several pages with multi-page drawings used mainly for presentations. The Pages pane, on the left side of the main window, provides an overview of pages created in a drawing. If the Pages pane is not visible, select View > Page Pane on the Menu bar. To make changes page order, drag and drop pages displayed in the Pages pane.
The large area in the center of the main window (Figure 1) is the Workspace where drawings are created. This drawing area can be surrounded with toolbars and information areas. The number and position of visible tools varies with the task being carried out, user preferences, and computer setup. The maximum size of a drawing page in Draw is limited by computer setup and the page size that that can be set and used in a printer connected to the computer.
The Draw Sidebar has five main decks and is similar to the Sidebar in other LibreOffice modules. To open a deck, click on its icon on the right of the Sidebar, or click on Sidebar Settings at the top of the Sidebar and select a deck from the drop-down list. If the Sidebar is not visible, select View > Sidebar on the Menu bar, or use the keyboard shortcut Ctrl+F5 (macOS ⌘+F5).
Properties
Styles
Gallery
Navigator
Shapes
Figure 2: Draw Status Bar
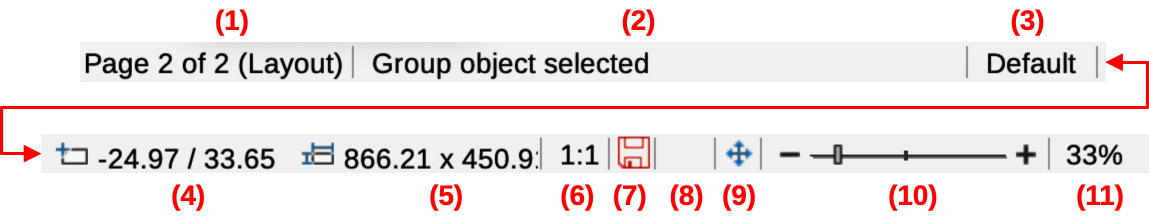
Slide (drawing) number
Information area
Master drawing
Cursor position
Selected object size
Document scaling factor
Unsaved changes
Digital signature
Fit drawing
Zoom slider
Zoom percentage
The Status Bar (Figure 2) is located at the bottom of the Workspace in all LibreOffice modules and includes Draw specific fields. For content details and use of these fields, see Chapter 1, LibreOffice Basics, and the Draw Guide. To hide the Status Bar, select View on the Menu bar and deselect Status Bar from the submenu.
Note
The measurement units displayed on the Status Bar are set by going to Tools > Options > LibreOffice Draw > General (macOS LibreOffice > Preferences > LibreOffice > General) on the Menu bar. These measurement units can be different to the measurement units set for the rulers displayed in the Draw main window.
A layer is a workplace where drawing elements and objects can be inserted. By default, the Workspace consists of three layers (Layout, Controls and Dimension Lines). Tabs for the default layers appear at the bottom of the Workspace. Default layers cannot be deleted or renamed, but layers can be added when required.
Tabs for layers appear in the Layers bar at the bottom of the Workspace. Hovering over a tab will highlight the objects that have been placed on a tab. Use the Layers bar to navigate between layers, add layers as required, or delete layers that have been created. For more information on layers, see “Working with layers” below.
Rulers are positioned on the Workspace upper and left-hand sides. If the rulers are not visible, select View > Rulers in the Menu bar, or use the keyboard shortcut Ctrl+Shift+R (macOS ⌘+Shift+R). The rulers show the size of a selected object on the page using double lines (highlighted in Figure 3). Also, rulers are used to manage object handles and guide lines when positioning objects.
Page margins in the drawing area are represented on the rulers. Change the margins directly on the rulers by dragging with the cursor. Margin areas are normally indicated by a grayed out area on the rulers, but does depend on computer operating system and setup.
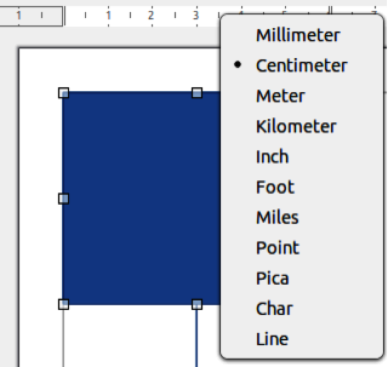
To change the ruler measurement units, right-click on a ruler and select the measurement unit from the drop-down list, as shown in Figure 4 for the horizontal ruler. Measurement units for the horizontal and vertical rulers can be different measurement units.
Figure 3: Example of rulers showing object size
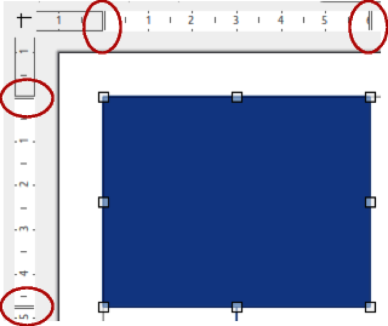
Figure 4: Example of ruler measurement units
To display or hide the Draw toolbars, select View > Toolbars on the Menu bar and select the required toolbar from the submenu. For more information on toolbars, see the Draw Guide.
The icons used for the tools on each toolbar depend on the computer operating system and how LibreOffice has been set up on a computer. For more information, see Chapter 12, Configuring LibreOffice. The four main toolbars used in Draw are as follows:
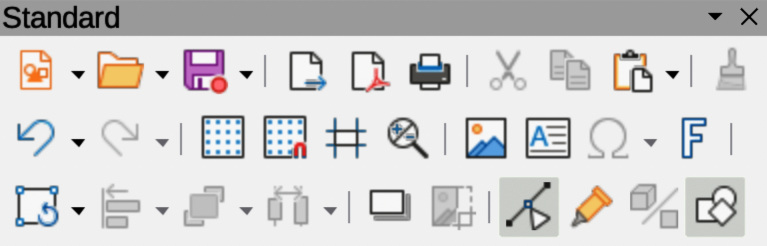
The Standard toolbar (Figure 5) is similar for all LibreOffice modules. By default, it is locked into position at the top of the main window when a document is opened.
Figure 5: Standard toolbar
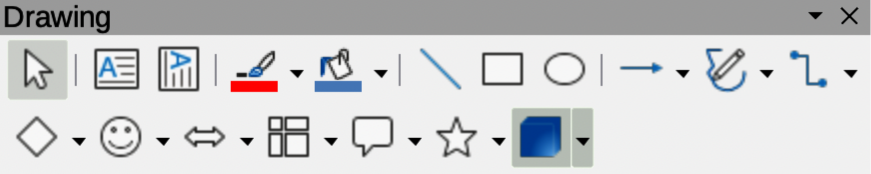
The Drawing toolbar (Figure 6) contains all the necessary functions for drawing various geometric and freehand shapes, and for organizing them in the drawing. By default, it is locked into position on the left of the main window.
Figure 6: Drawing toolbar
The Line and Filling toolbar (Figure 7) is normally docked at the top of the main window, below the Standard toolbar, and is used to modify the main properties of a drawing object. The tools and pull-down lists vary according to the type of object selected. The Line and Filling toolbar only becomes active when an object on the Workspace is selected.
Figure 7: Line and Filling toolbar
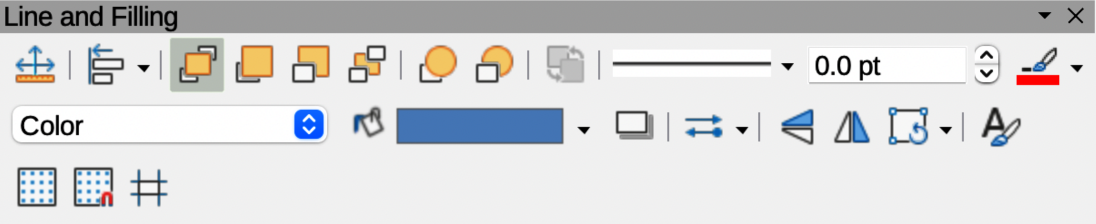
Figure 8: Text Formatting toolbar
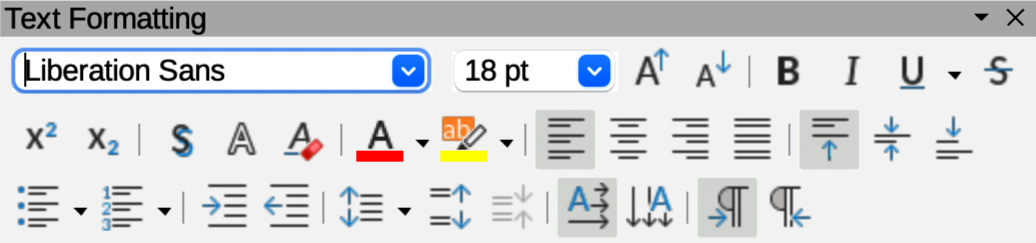
The Text Formatting toolbar (Figure 8) is similar to the Formatting toolbar in Writer. It is only available when text, or a text object, has been selected in a drawing. The Text Formatting toolbar replaces the Line and Filling toolbar when it opens.
Draw provides a wide range of basic shapes located on the Drawing toolbar (Figure 6) and the Shapes deck on the Sidebar (Figure 9). Some of the basic shape icons on the Drawing toolbar change according to the shape that has been selected. Also, some basic shapes on a toolbar have a sub-toolbar available and these are indicated by a triangle ▼ to the right of the tool icon. See the Draw Guide for a complete description of the basic shapes available and how to access the subtoolbars.
Note
When drawing basic shapes, or selecting a shape for editing, the information area in the Status bar changes to reflect the present action, for example Line created, Text frame xxyy selected, and so on.
A straight line is the simplest element or object to create in Draw.
Use one of the following methods to start drawing a line:
Click on Insert Line on the Drawing toolbar (Figure 6).
Figure 9: Shapes deck on Sidebar
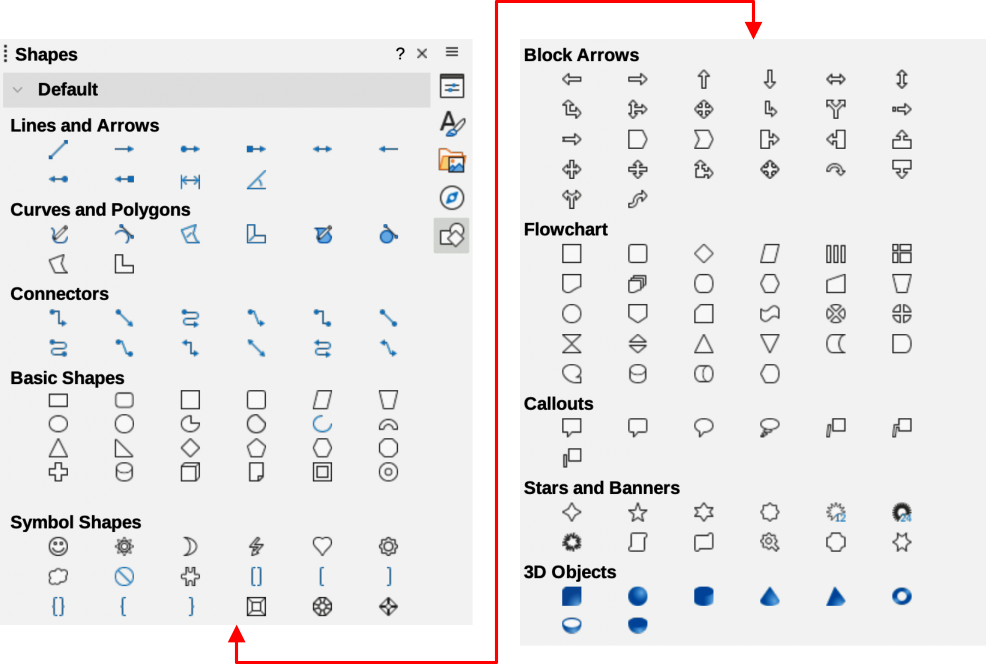
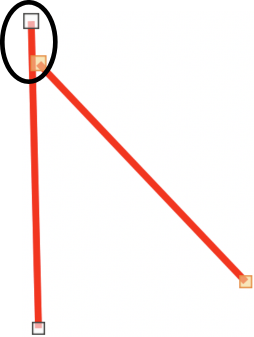
Figure 10: Example of line starting point
Click the triangle ▼ on the right of Lines and Arrows on the Drawing toolbar and select Insert Line in the context menu.
Click on Insert Line in the Lines and Arrows panel in the Shapes deck on the Sidebar (Figure 9).
Place the cursor at the starting point on the drawing, then click and drag the cursor to draw a straight line.
Release the cursor when the end point is reached and a straight line is created. A selection handle appears at each end of the line, showing that this object is selected. The selection handle at the starting point of the line is larger than the end point (highlighted in Figure 10).
Tips
To snap the end of a line to the nearest grid point, keep the Ctrl key (macOS ⌘) pressed while drawing the line. However, if the Snap to Grid option in View > Snap Guides on the Menu bar is selected, the Ctrl key (macOS ⌘) deactivates the snap to grid.
To restrict the drawing angle of a line to multiples of 45 degrees, keep the Shift key pressed while drawing the line. However, if the option When creating or moving objects in the Constrain Objects section of Tools > Options > LibreOffice Draw > Grid (macOS LibreOffice > Preferences > LibreOffice Draw > Grid) has been selected, the Shift key deactivates this restriction.
To draw a line symmetrically outwards in both directions from the start point, keep the Alt key (macOS ⌥) pressed while drawing the line. Lines are drawn starting from the center of the line.
A line is drawn using default attributes. To change line attributes and format a line to the drawing requirements, select the line by clicking on it and use one of the following methods to access formatting options for the line:
Go to the Properties deck on the Sidebar and open the Line panel (Figure 11).
Right-click on a line and select Line in the context menu to open the Line dialog (Figure 12).
Go to Format > Line on the Menu bar to open the Line dialog.
Use the tools Line Style, Line Width, and Line Color on the Line and Filling toolbar (Figure 7).
Figure 11: Line panel in Properties deck on Sidebar
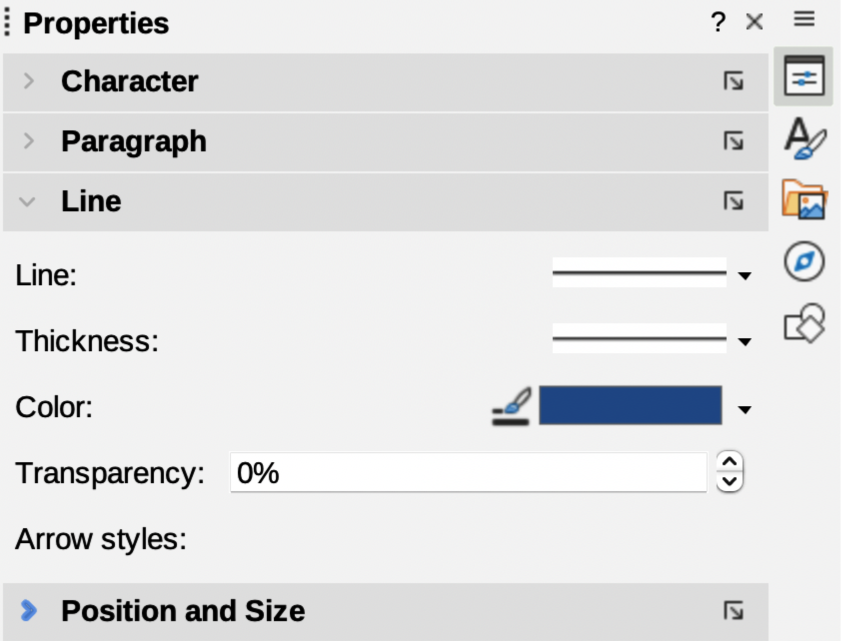
Figure 12: Line dialog — Line page
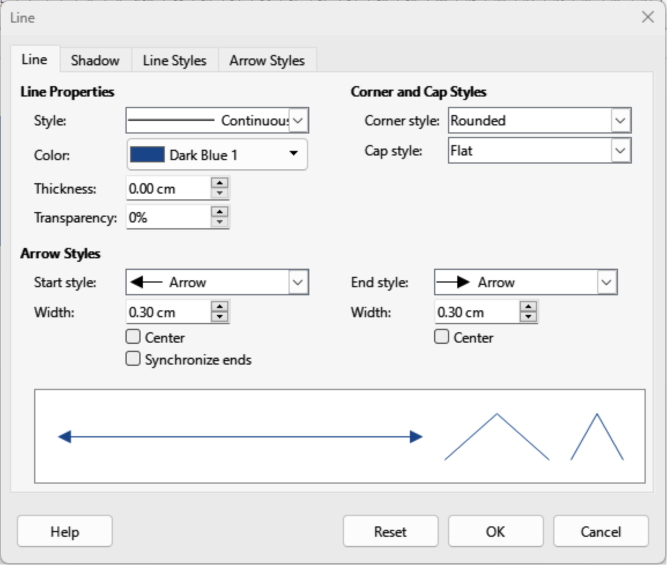
Figure 13: Lines and Arrows sub-toolbar
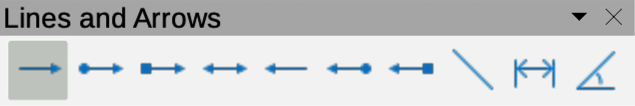
Figure 14: Drawing toolbar
Draw classifies both lines and arrows as lines. Arrows are drawn like straight lines. Hovering the cursor over each tool in the Lines and Arrows sub-toolbar (Figure 13) indicates what type of line, or arrow, each tool creates. The information field on the Status bar shows them only as lines.
Use one of the following methods to draw a line or arrow:
Click the triangle ▼ on the right of Lines and Arrows on the Drawing toolbar (Figure 14) and select the type of arrow required from the Lines and Arrows sub‑toolbar (Figure 13).
Click on the type of arrow required in the Lines and Arrows panel of the Shapes deck on the Sidebar (Figure 9).
Place the cursor at the starting point of the line or arrow, then click and drag the cursor. The arrowhead is created when the cursor is released.
Notes
The tool icon for the Lines and Arrows tool previously used is shown on the Drawing toolbar making it easier to use the same tool again.
After drawing a line, or arrow, the style for line or arrow is changed by opening the Line dialog (Figure 12) and using the options available on the Line Styles or Arrow Styles pages.
Use one of the following methods to start drawing a rectangle or square:
Click on Rectangle on the Drawing toolbar .
Click the triangle ▼ on the right of Basic Shapes on the Drawing toolbar (Figure 14) and select Rectangle or Square on the pop-up Basic Shapes sub-toolbar.
Click on Rectangle or Square in the Basic Shapes panel of the Shapes deck on the Sidebar (Figure 9).
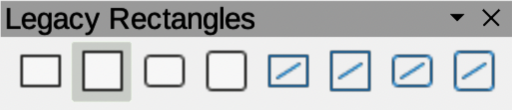
Select the type of rectangle or square on the Legacy Rectangles toolbar (Figure 15). To display the toolbar, go to View > Toolbars on the Menu bar and select it.
Figure 15: Legacy Rectangles toolbar
Place the cursor at the starting point for the rectangle or square, then click and drag the cursor until the required size is drawn. The rectangle or square is drawn from the starting point using the bottom right corner as the anchor point for the cursor.
If necessary, use one of the following options to draw a rectangle or square:
If a rectangle option is selected, hold down the Shift key while dragging the cursor to draw a square.
If a rectangle option is selected, hold down the Alt key while dragging the cursor to draw a rectangle from its center.
If a rectangle option is selected, hold down the Shift and Alt keys while dragging the cursor to draw a square from its center.
If a square option is selected, hold down the Shift key while dragging the cursor to draw a rectangle.
If a square option is selected, hold down the Alt key while dragging the cursor to draw a square from its center.
Note
If the option When creating or moving objects is selected in the Constrain Object section of Tools > Options > LibreOffice Draw > Grid (macOS LibreOffice> Preferences > LibreOffice Draw > Grid), the Shift key action is reversed. A square is drawn instead of a rectangle. Holding down the Shift key a rectangle is drawn. Shift key action reversal also applies to ellipses, circles, arcs, and segments.
Use one of the following methods to start drawing an ellipse or circle:
Click on Ellipse on the Drawing toolbar (Figure 14).
Select the type of ellipse or circle in the Basic Shapes panel in Shapes deck on the Sidebar (Figure 9).
Click on the triangle ▼ next to Basic Shapes on the Drawing toolbar and select the type of ellipse or circle required from the pop-up Basic Shapes sub-toolbar.
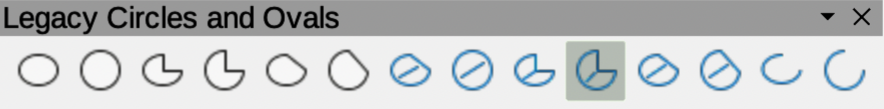
Select the type of ellipse or circle on the Legacy Circles and Ovals toolbar (Figure 16). To display the Legacy Circles and Ovals toolbar, go to View > Toolbars on the Menu bar and select it.
Figure 16: Legacy Circles and Ovals toolbar
Place the cursor at the starting point for the ellipse or circle, then click and drag the cursor until the required size is drawn. The ellipse or circle is drawn from the starting point using the bottom right corner as the anchor point for the cursor.
If necessary, use one of the following options while drawing an ellipse or circle:
If an ellipse option is selected, hold down the Shift key while dragging the cursor to draw a circle.
If an ellipse option is selected, hold down the Alt key while dragging the cursor to draw an ellipse from its center.
If an ellipse option is selected, hold down the Shift and Alt keys while dragging the cursor to draw a circle from its center.
If a circle option is selected, hold down the Shift key while dragging the cursor to draw an ellipse.
If a circle option is selected, hold down the Alt key while dragging the cursor to draw a circle from its center.
Tip
To quickly insert an object, press and hold down the Ctrl (macOS ⌘) key, then click on an object tool on the Drawing toolbar. A standard sized object of the selected object is drawn in the center of the Workspace. The size, shape, and color used are default settings. These attributes can be changed later. For more information, see the Draw Guide.
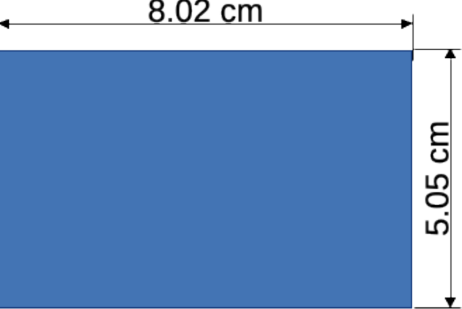
Dimension lines display a measurement of an object in the drawing (Figure 17). A dimension line does not belong to the object itself, but is positioned close to it. An object can have as many dimension lines that are required to indicate the dimensions of sides, edges, distances, and so on.
Figure 17: Example of object dimension lines
Use one of the following methods to start drawing a dimension line:
Click the triangle ▼ on the right of Lines and Arrows on the Drawing toolbar (Figure 14) and select Dimension Line on the Lines and Arrows sub‑toolbar that opens.
Click on Dimension Line in the Lines and Arrows panel of the Shapes deck on the Sidebar (Figure 9).
Place the cursor close to the object to position the start of the dimension line.
Click and drag the cursor to draw the dimension line. As the dimension line is drawn, the dimension is displayed and automatically calculated. To change the measurement unit used for dimension lines, go to Tools > Options > LibreOffice Draw > General (macOS LibreOffice > Preferences > LibreOffice Draw > General) on the Menu bar.
To change the display of a dimension line and its appearance, right-click on the dimension line and select Dimensions in the context menu to open the Dimension Line dialog (Figure 18).
Select the required options in Line and Legend, then click OK to save the changes and close the Line Dimension dialog.
Figure 18: Dimension Line dialog
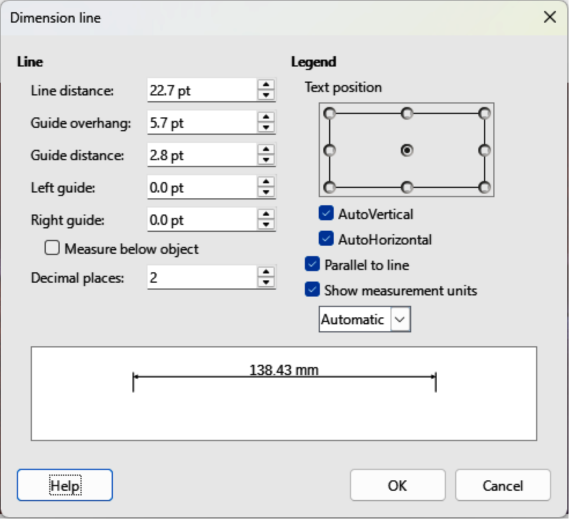
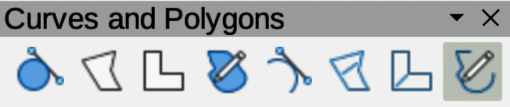
Figure 19: Curves and Polygons sub-toolbar
Use one of the following methods to start drawing a curve:
Click the triangle ▼ on the right of Curves and Polygons on the Drawing toolbar and select the type of curve on the Curves and Polygons sub-toolbar (Figure 19).
Click on the type of curve required in the Curves and Polygons panel of the Shapes deck on the Sidebar (Figure 9).
Click and hold the left mouse button to create the starting point of the curve, then drag from the starting point to draw a line. Release the mouse button and continue to drag the cursor to bend the line into a curve.
Double-click to set the end point of the curve and fix the curve on the drawing. A filled curve automatically joins the last point to the first point, closing the curve and filling it with the selected fill color. A curve without fill will not be closed at the end of drawing the curve.
Note
A single click fixes the curve to the drawing and allows drawing of straight lines from the end of the curve. Each single click allows the drawing of another straight line. Double-click to end drawing a curve with straight lines.
Use one of the following methods to start drawing a polygon:
Click the triangle ▼ on the right of Curves and Polygons on the Drawing toolbar and select the type of polygon on the Curves and Polygons sub-toolbar (Figure 19).
Click on the type of polygon required in the Curves and Polygons panel of the Shapes deck on the Sidebar (Figure 9).
Click to create the starting point of the polygon, then drag from the starting point to draw a line.
Release the hold and continue to drag the cursor to draw the next line for polygon, then click again to mark the end point of the line and start drawing another line. Holding the Shift key down while drawing lines restricts the angles used in the polygon to 45° or 90°.
A polygon 45° is drawn using the same procedure as polygons, but the angles between lines are restricted to 45° or 90°. This restriction of angles cannot be changed. However, hold down the Shift key to draw a line at an angle other than 45 or 90 degrees.
A filled polygon 45° automatically joins the last point to the first point, closing the polygon and filling it with the selected fill.
Drawing a free-form line is similar to drawing with a pencil on paper.
Use one of the following methods to start drawing a free-form line:
Click the triangle ▼ on the right of Curves and Polygons on the Drawing toolbar and select the type of free-form line on the Curves and Polygons sub-toolbar (Figure 19).
Click on the type of free-form line required in the Curves and Polygons panel of the Shapes deck on the Sidebar (Figure 9).
Click and drag the cursor to create the free-form line shape required.
Release the hold when satisfied with the free-form line and the drawing is completed. A filled free-form line automatically joins the last point to the first point, closing the free-form line and filling it with the selected fill.
All Draw objects have gluepoints and are not normally displayed. Gluepoints (Figure ) only become visible on an object when a connector is selected on the Drawing toolbar or in the Shapes deck on the Sidebar.
Most objects have four gluepoints (Figure 20). More gluepoints can be added and customized using the Gluepoints toolbar (Figure 21). If the Gluepoints toolbar is not visible, go to View > Toolbars > Gluepoints on the Menu bar to open the toolbar. For a more detailed description on adding and using gluepoints, see the Draw Guide.
Gluepoints are not the same as the selection handles of an object. Selection handles are for moving or changing the shape of an object. Gluepoints are used to fix or glue a connector to an object so that when the object moves, the connector stays fixed to the object.
Figure 20: Example of object gluepoints
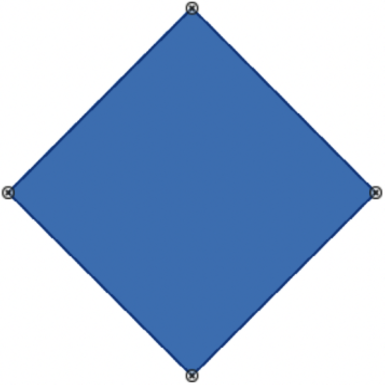
Figure 21: Gluepoints toolbar
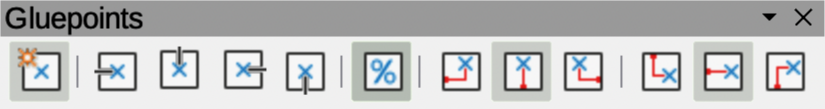
Figure 22: Example of connectors between objects
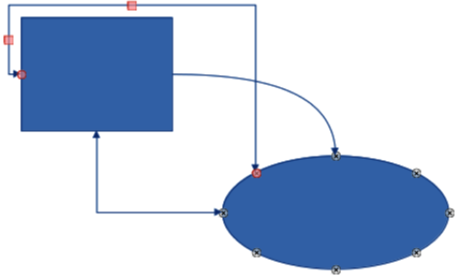
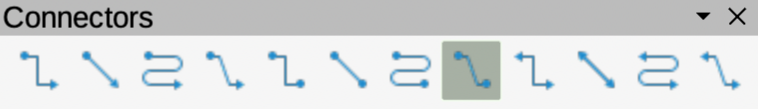
Figure 23: Connectors sub-toolbar
Connectors are lines or arrows whose ends automatically snap to a gluepoint of an object. Connectors are especially useful in drawing organization charts, flow diagrams, and mind-maps. When objects are moved or reordered, the connectors remain attached to a gluepoint. Figure 22 shows an example of using two objects and a connector. For a more detailed description of the use of connectors, see the Draw Guide.
Use one of the following methods to select a connector:
Click the triangle ▼ on the right of Connectors on the Drawing toolbar and select the type of connector on the Connectors sub-toolbar (Figure 23).
Click on the type of connector required in the Connectors panel of the Shapes deck on the Sidebar (Figure 9).
Move the cursor over one of the objects to be connected. Small crosses (gluepoints) appear around the object edges. Click on the required gluepoint for the start of the connector, then drag the cursor to drag the connector to another object.
When the cursor is over a gluepoint of the target object, release the connector to draw the connector between objects. The connector end point is attached to the gluepoint.
Geometric shapes are similar to basic shapes. They are provided in Draw as a starting point when creating objects for a drawing. Geometric shapes are located on the Drawing toolbar (Figure 6) and in the Shapes deck on the Sidebar (Figure 9). The tool icons on the Drawing toolbar always indicate the last geometric shape drawn, making it easier to use the same tool again.
Access geometric shapes using one of the following methods:
Click on Shapes on the Sidebar to open the Shapes deck, then select from the geometric shapes available.
Click the triangle ▼ on the right of a geometric shape on the Drawing toolbar to open a sub-toolbar providing access to more geometric shape tools.
Using geometric shapes is similar to drawing rectangles, squares, ellipses, or circles as explained in “Drawing basic shapes” above. Text can be added to all geometric shapes. See “Adding and formatting text” below and the Draw Guide.
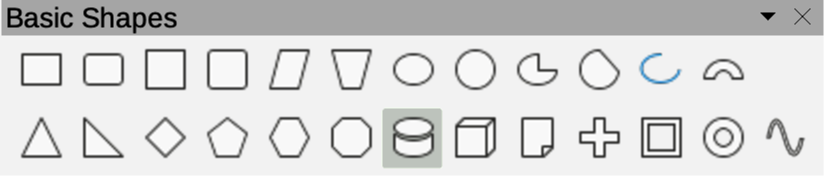
The Basic Shapes sub-toolbar (Figure 24) also includes rectangle and ellipse tools that are identical to the ones displayed on the Drawing toolbar. The basic shapes are numbered from left to right as they appear on the sub-toolbar.
Figure 24: Basic Shapes sub-toolbar
Rectangle
Rectangle, Rounded
Square
Square, Rounded
Parallelogram
Trapezoid
Ellipse
Circle
Circle Pie
Circle Segment
Arc
Block Arc
Isosceles Triangle
Right-angle Triangle
Diamond
Regular Pentagon
Hexagon
Octagon
Cylinder
Cube
Folded Corner
Cross
Frame
Ring
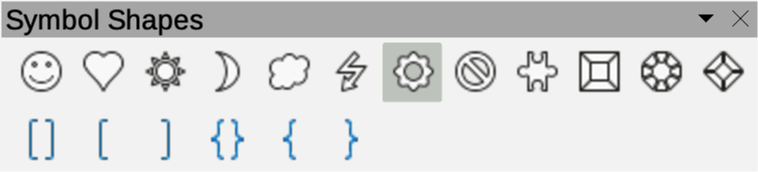
Symbol Shapes (Figure 25) are numbered from left to right as they appear on the sub-toolbar.
Figure 25: Symbol Shapes sub-toolbar
Smiley Face
Heart
Sun
Moon
Cloud
Lightning Bolt
Flower
Prohibited
Puzzle
Square Bevel
Octagonal Bevel
Diamond Bevel
Double Bracket
Left Bracket
Right Bracket
Double Brace
Left Brace
Right Brace
Block Arrows (Figure 26) are numbered from left to right as they appear on the sub-toolbar.
Figure 26: Block Arrows sub-toolbar
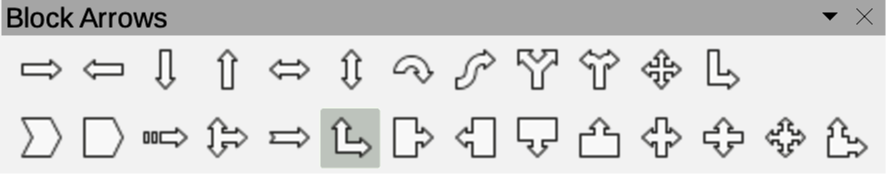
Right Arrow
Left Arrow
Down Arrow
Up Arrow
Left and Right Arrow
Up and Down Arrow
Circular Arrow
S-shaped Arrow
Split Arrow
Right or Left Arrow
4-way Arrow
Corner Right Arrow
Chevron
Pentagon
Striped Right Arrow
Up, Right and Down Arrow
Notched Right Arrow
Up and Right Arrow
Right Arrow Callout
Left Arrow Callout
Down Arrow Callout
Up Arrow Callout
Left and Right Arrow Callout
Up and Down Arrow Callout
4-way Arrow Callout
Up and Right Arrow Callout
Flowchart (Figure 27) are numbered from left to right as they appear on the sub-toolbar.
Figure 27: Flowchart sub-toolbar
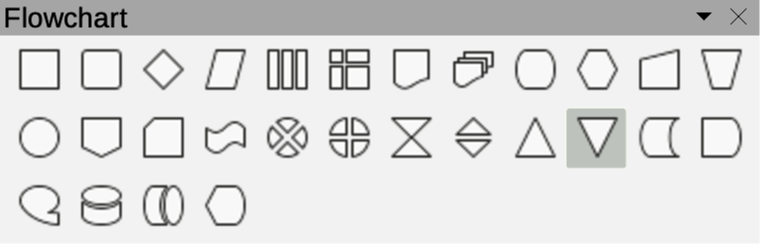
Process
Alternate Process
Decision
Data
Predefined Process
Internal Process
Document
Multidocument
Terminator
Preparation
Manual Input
Manual Operation
Connector
Off-page Connector
Card
Punched Tape
Summing Junction
Or
Collate
Sort
Extract
Merge
Stored Data
Delay
Sequential Access
Magnetic Disc
Direct Access Storage
Display
Callouts (Figure 28) are numbered from left to right as they appear on the sub-toolbar.
Figure 28: Callouts sub-toolbar
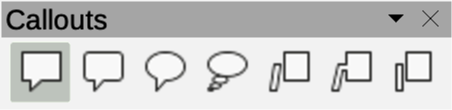
Rectangular Callout
Rounded Rectangular Callout
Round Callout
Cloud
Line Callout 1
Line Callout 2
Line Callout 3
Stars and Banners (Figure 29) are numbered from left to right as they appear on the sub-toolbar.
Figure 29: Stars and Banners sub-toolbar
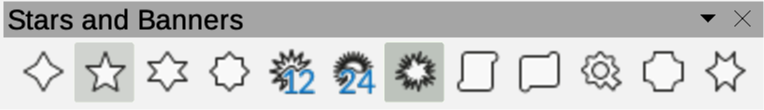
4-Pointed Star
5-Pointed Star
6-Pointed Star
8-Pointed Star
12-Pointed Star
24-Pointed Star
Explosion
Vertical Scroll
Horizontal Scroll
Signet
Door-plate
6-Point Star, Concave
3D-Objects (Figure ) are numbered from left to right as they appear on the sub-toolbar.
Figure 30: 3D-Objects sub-toolbar
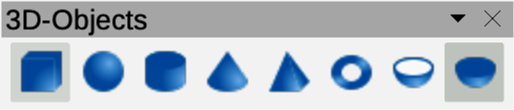
Cube
Sphere
Cylinder
Cone
Pyramid
Torus
Shell
Hemisphere
Text can be added to drawings created in Draw. This section gives some guidelines on how to add text and change its appearance. Text added to drawings can be contained in text boxes, objects, or shapes. For more information on adding and formatting text, see the Draw Guide.
A text box is an independent object that is dynamic and expands as more text is added within the frame.
An object or shape in a drawing is not dynamic, which means that the boundary rectangle does not expand as text is added. Care must be taken when adding text to prevent the text from extending outside the object or shape boundaries.
Before adding any text to a drawing, text mode has to be activated using one of the following methods. The Text Formatting toolbar (Figure 8) automatically opens when text mode is activated, replacing the Line and Filling toolbar.
For horizontal text, click on Insert Text Box on the Drawing or Text toolbar to create a text box.
For horizontal text, go to Insert > Text Box on the Menu bar to create a text box.
For horizontal text, use the keyboard shortcut F2 to create a text box.
For vertical text, click on Insert Vertical Text on the Drawing or Text toolbar to create a vertical text box.
Double-click inside an object on the drawing and the object switches to text mode with a flashing cursor inside the object.
Note
Inserting and formatting vertical text and vertical text boxes is the same as horizontal text and horizontal text boxes. A vertical text box expands vertically as text is added into the box. For more information on vertical text, see the Draw Guide.
Create a text box in the drawing using one of the following methods. The Status Bar indicates Text Edit mode and the position of the cursor (Figure 31).
Click at the approximate position for the text box and a single line text box is created containing a flashing cursor. Start typing the text or paste copied text into the text box. The width of a single line text box increases as text is added.
Click at the approximate position for the text and drag the cursor to the approximate width required for the text box creating a multi-line text box. Start typing the text, or paste copied text into the text box. As the horizontal limit of the text box is reached, the text automatically word wraps inside the text box and the text box expands vertically as it fills.
If necessary, create multiple lines of text in a single-line text box by pressing Enter to create a new paragraph, or using Shift+Enter to create a line break in the text.
Figure 31: Example of text information on Status Bar
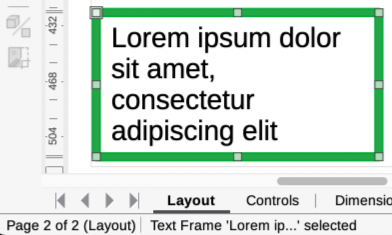
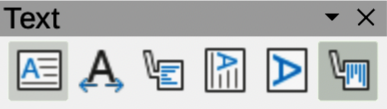
Figure 32: Text toolbar
When adding text is complete, click outside the text box to exit text mode. The Text Formatting toolbar closes and the Line and Filling toolbar opens in its original position.
To format and/or reposition the text box, see the Draw Guide for more information.
By default, Draw is set for horizontal text only. Enabling vertical text is as follows:
Go to Tools > Options > Language Settings > Languages (macOS LibreOffice > Preferences > Language Settings > Languages).
Under Default Languages for Documents, select Asian and accept the default language displayed.
Right-click in a blank area on the Drawing toolbar and select Visible Buttons in the context menu.
Select Insert Vertical Text from the list of available tools to enable vertical text on the Drawing toolbar.
Alternatively, go to View > Toolbars on the Menu bar and select the Text toolbar (Figure 32) from the drop-down list, then select Insert Vertical Text from the tools available on the Text toolbar.
Text can be added to most Draw objects, but there are some exceptions. For example, control elements, buttons, polygons, curves, or 3D objects.
By default, an object is not dynamic when created in Draw and does not behave like a text box. Text added to an object does not word wrap inside an object. To keep text within the borders of an object, use word wrap, paragraphs, line breaks, smaller text size, increasing object size, or a combination of all methods. For more information on adding text to objects, see the Draw Guide.
Create an object in a drawing and make sure the object is selected with the selection handles displayed.
Enter text mode on a selected object using one of the following methods:
Click on Insert Text Box for horizontal text, or Insert Vertical Text for vertical text on the Drawing, Standard, or Text toolbar.
For horizontal text only, double-click on the selected object.
Type or paste text into the selected object.
If the text goes outside the object borders, format the text using one of the following methods. For more information on text formatting, see the Draw Guide.
Tools on the Text Formatting toolbar.
Panels in the Properties deck on the Sidebar.
Options in Format on the Menu bar, or Text page in the Text dialog.
Click outside the object to deselect it ending text mode and saving any changes.
Unordered (bulleted) or ordered (numbered) lists can be created in text boxes and objects. For more information on creating and formatting lists, see the Draw Guide.
Switch on text mode and select all of the text required for a list, or type the required text.
Create a list using one of the following methods and default settings for lists:
Click on Toggle Unordered List, or Toggle Ordered List on the Text Formatting toolbar.
Click on Toggle Unordered List, or Toggle Ordered List in the Lists panel in the Properties deck on the Sidebar.
Go to Format > Lists > Unordered List, or Ordered List on the Menu bar.
To change the format of the list, click on the triangle ▼ on the right of the list tools in the toolbars, or Lists panel in the Sidebar, and select a list style from the options available.
Text in a drawing can be formatted into columns inside text boxes and objects. However, if text columns are to be used in a text box or object, then the whole of a text box or object has to be used for columns. For more information on text columns, see the Draw Guide.
Note
Any text inside a text box, or graphic object automatically flows into column format when the changes are saved.
For text boxes — click the border of a text box to select it so that the selection handles are displayed indicating that the text box is in edit mode.
For graphic objects — double-click on a graphic object to select it so that the selection handles are displayed and the cursor flashes in the center of the object indicating that the object is in text edit mode.
Open the options for text columns using one of the following methods:
Right-click in the text box or graphic object and select Text Attributes in the context menu to open the Text dialog, then click on Text Columns to open the Text Columns page,
Click on Columns in the Properties deck on the Sidebar to open the Columns panel.
Set the number of columns required in the Number of columns box and the required spacing between the columns in the Spacing box.
Type in the required text, or use copy and paste to enter the required text into the text box or graphic object. Any text entered will be in column format.
If necessary, format the text to the drawing requirements.
Save the changes and deselect the text box, or graphic object, using one of the following methods:
For the Text dialog, click OK to save the changes and close the dialog, then click outside the text box to deselect it.
For the Columns panel in the Properties deck on the Sidebar, click outside the text box or graphic object to deselect it and save the changes.
Click outside the text box, or graphic object, to deselect and save all the changes.
The easiest way to select an object is to click directly on it. For objects that are not filled, click on the object border to select it. To select, or deselect, more than one object, hold the Shift key down while clicking on each object.
Several objects can be selected at the same time by clicking and dragging the cursor to create a selection rectangle (also known as a marquee) around objects. Only objects that lie entirely within this selection rectangle are selected. To select multiple objects by framing, Select on the Drawing toolbar must be active.
If objects are located behind others and not visible, they can still be selected. When selecting a hidden object, its selection handles appear through the objects covering it.
Windows, macOS or Linux — press the Tab key to select and cycle through the objects in a drawing, stopping at the hidden object to select it. To cycle through the objects in reverse order, press Shift+Tab.
Windows or macOS only — select the object in front of a hidden object, then press the Alt key (macOS ⌥) and click to select the hidden object. If there are several hidden objects, keep holding down the Alt key (macOS ⌥) and clicking until the object required is reached. To cycle through the objects in reverse order, hold down the Alt+Shift keys (macOS ⌥+Shift) and click.
In a complex drawing, several objects may be stacked on top of one another. This stacking order can be rearranged by moving an object forward, or backward, using one of the following methods:
Select an object, go to Shape > Arrange on the Menu bar, or right-click on the object and select Arrange in the drop-down menu, then choose one of the following options:
Bring to Front (Ctrl+Shift++) (macOS ⌘+Shift++)
Bring Forward (Ctrl++) (macOS ⌘++)
Send Backward (Ctrl+-) (macOS ⌘+–)
Send to Back (Ctrl+Shift+-) (macOS ⌘+Shift+–)
In Front of Object
Behind Object
Reverse — using on this option reverses the order of the selected objects.
Select an object, then click on one of the Arrange tools, listed above, on the Line and Filling toolbar. When hovering the cursor over a tool, its function is indicated.
When positioning or changing the size of an object, check the information area of the Status bar at the bottom of the Workspace (Figure 33). From left to right, it shows what object is selected, its position on the drawing in X/Y coordinates, and the dimensions of the object.
Figure 33: Example of object information on Status Bar
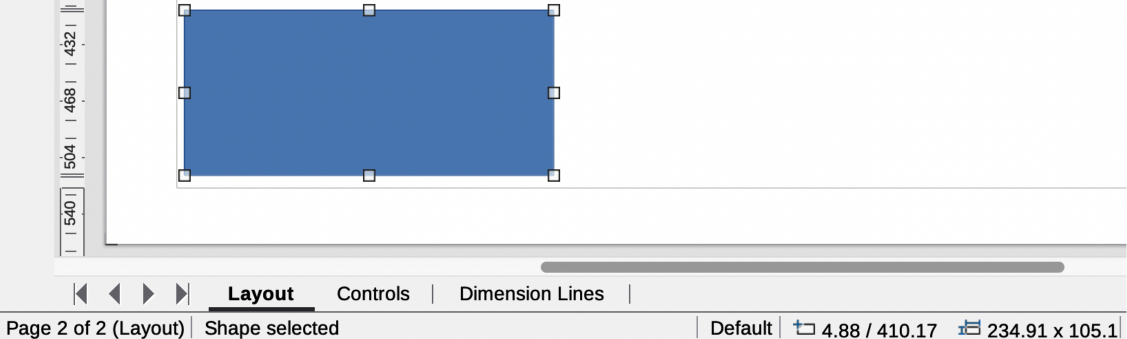
Figure 34: Example of moving objects
The measurement units are those selected in Tools > Options > LibreOffice Draw > General (macOS LibreOffice > Preferences > LibreOffice Draw > General) For more information on positioning and adjusting objects, see the Draw Guide.
To help in the positioning and adjustment of objects, Draw has a zoom function that reduces or enlarges the screen display of the current drawing. For example, zoom in to position objects on a drawing with greater accuracy; zoom out to see the complete drawing. Zooming is controlled using the Status Bar, Zoom & View Layout dialog, or Zoom toolbar. For more information on using zoom, see the Draw Guide.
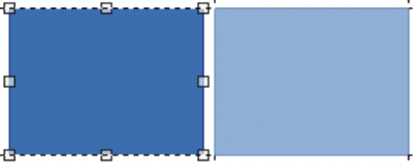
To move an object (or a group of objects), select it within the object borders, then click and drag the object. Release the object when it is in its correct position. Whilst moving the object, a ghost image of the object appears helping with repositioning (Figure 34).
To change the size of a selected object (or a group of selected objects), move the cursor to one of the selection handles. The cursor changes shape to indicate the direction of movement for that selection handle. As the object size changes, a ghosted outline of the object appears (Figure 35). When the desired size of the object is reached, release the object. How an object is resized depends on which selection handle is being used. To resize an object along one axis, use a side, top, or bottom handle. To resize along both axes, use a corner handle.
Note
Press and hold the Shift key while resizing an object, the change in size is carried out symmetrically with respect to the object width and height maintaining the aspect ratio of the object. This Shift key behavior works on all selection handles.
Figure 35: Example of adjusting object size
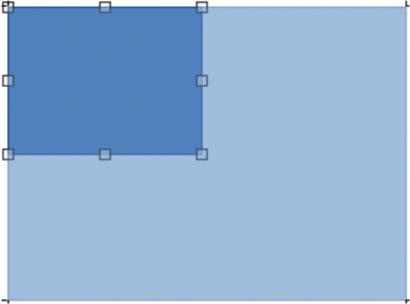
Figure 36: Example of rotating objects
To rotate or slant an object (or a group of objects), select it and switch to rotation mode using one of the following methods:
Right-click on the object and select Transformations > Rotate in the context menu.
Click on the triangle ▼ on the right of Transformations on the Standard or Line & Filling toolbars and select Rotate.
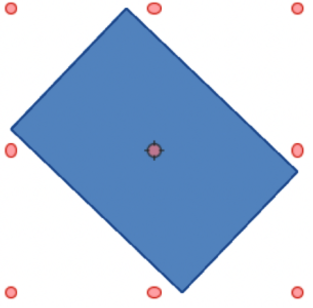
The selection handles change shape and color with a center of rotation appearing in the center of the object. As the cursor is moved over the handles, the cursor changes shape to indicate the type of movement.
Click on and hold a corner selection handle, then drag the cursor to rotate the object around the rotation point. A ghost image of the object rotation appears and the current angle of rotation is shown in the Status Bar (Figure 36).
When the object is at the required rotation angle, release the object.
To change the type of rotation, click on the rotation point in the center of an object and drag it to another position. The rotation point can be moved outside of the object boundaries.
Note
Press the Shift key while rotating or slanting an object and the movement is restricted to 15°.
Click on a selection handle at the top, bottom, left side, or right side of an object. The cursor changes shape indicating the direction of movement.
Drag the selection handle to slant the object. A ghost image of the object being slanted appears (Figure 37) and the current slant angle is shown in the Status Bar. The axis used for slanting an object is fixed to the edge of the object directly opposite the selection handle being used to slant the object.
When the object is at the desired slant angle, release the object.
Select an object so that the selection handles are displayed and flip the object vertically or horizontally using one of the following methods:
Right-click on the object and select Flip > Vertically, or Horizontally, in the context menu.
Go to Shape > Flip > Vertically, or Horizontally, on the Menu bar.
Click on Vertically, or Horizontally, tool on the Line and Filling toolbar.
Use Flip Vertically, or Flip Horizontally, tool in the Position and Size section on the Properties deck of the Sidebar.
However, Flip on the Transformations toolbar (Figure 38) provides greater control over the flipping process. Use Flip to change the position and angle that the object flips over. See the Draw Guide for more information.
Figure 37: Example of slanting objects
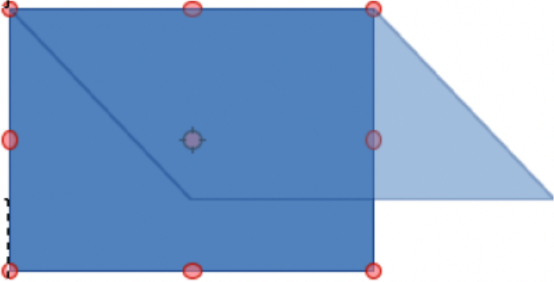
Figure 38: Transformations toolbar
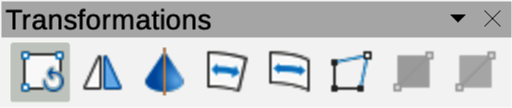
Three tools on the Transformations toolbar (Figure 38) allow the dragging of the corners and edges of an object to distort an object.
Distort — distorts an object in perspective.
Set in Circle (perspective) — creates a pseudo 3D effect.
Set to Circle (slant) — creates a pseudo 3D effect. Despite the (slant) in the name of this tool, it operates differently from slanting using rotation.
To use object distortion, the object has to be converted first into a curve. This is a necessary step, so click Yes, then move the object handles to produce the desired effect. See the Draw Guide for more information on how to distort an object.
Transparency gradients can be controlled the same as color gradients and both types of gradient can be used together. With a transparency gradient, the direction and degree of the object fill color changes from opaque to transparent. In a color gradient, the fill changes from one color to another, but the degree of transparency remains the same. An example of a dynamic gradient is shown in Figure 39.
Two tools on the Transformations toolbar are used to dynamically control transparency and color gradients — Interactive Transparency and Interactive Gradient. See the Draw Guide for more information on how to create transparencies and gradients in an object.
Duplication makes copies of an object while applying a set of changes such as Color or rotation to the duplicates that are created. An example of duplication is shown in Figure 40. For more information on duplication, see the Draw Guide.
Figure 39: Example of dynamic gradients
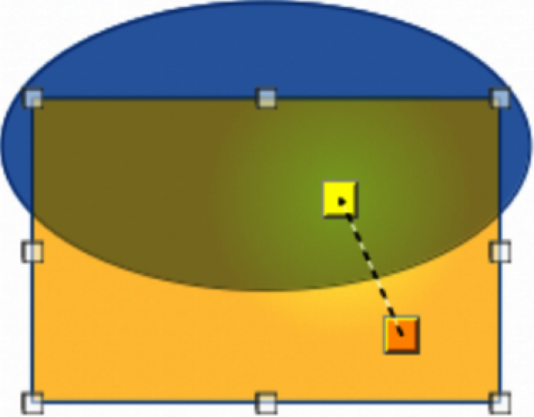
Figure 40: Example of duplicating objects
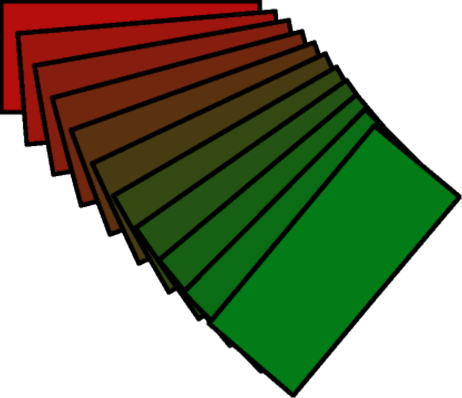
Figure 41: Duplicate dialog
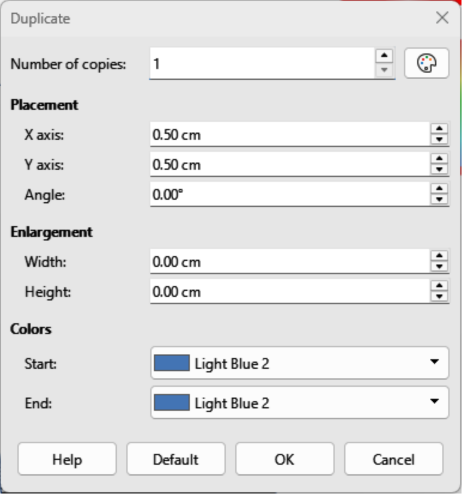
Click on an object or group of objects and open the Duplicate dialog (Figure 41) using one of the following methods:
Go to Edit > Duplicate on the Menu bar.
Go to Shape > Duplicate on the Menu bar.
Use the keyboard shortcut Shift+F3.
Select the required options in Number of copies, Placement, Enlargement, and Colors.
Click on OK to duplicate the object and close the Duplicate dialog.
Cross-fading transforms one object shape to another object shape. The result is a new group of objects with the first object selected as the start object and the second object selected as the end object. For example, when the options in the Cross-fading dialog are applied to a rectangle and an oval, the cross-fading produces the result shown by the example in Figure 42.
Select two differently shaped objects and go to Shape > Cross-fading on the Menu bar to open the Cross-fading dialog (Figure 43).
In Increments enter the number of shapes between the two objects.
Select Cross-fading attributes to apply a gradual change of line and fill properties between the two objects.
Select Same orientation to apply a smooth transition between the two objects.
Click on OK to create cross-fading between objects and close the Cross-fading dialog.
Figure 42: Example of cross fading objects
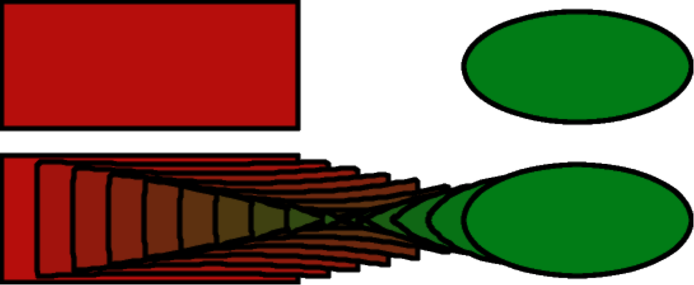
Figure 43: Cross-fading dialog
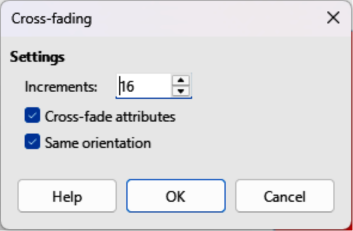
Figure 44: Example of grouping and combining objects
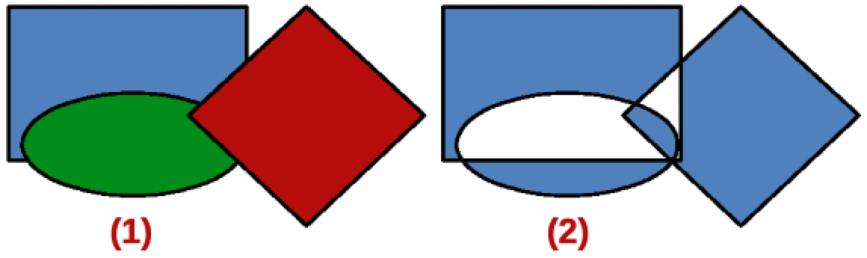
Using Draw, a group of objects can be grouped together (Example (1) in Figure 44) allowing multiple objects to be treated as one object, or combined to create a new shape (Example (2) in Figure 44). For more information on grouping and combining objects, see the Draw Guide.
Grouping of objects is similar to putting objects into a container. The objects can be moved as a group and global changes applied to the objects within the group. A group can always be undone (ungroup). Objects that make up a group can always be manipulated separately and retain their own individual properties.
A temporary grouping is when several objects are selected using one of the following methods:
While holding down the Shift key, click on each object with the cursor to select it for the temporary group.
Click and drag the cursor to create a rectangle (also known as a marquee) around the objects required for the temporary group.
Any changes to object parameters carried out are applied to all the objects within the temporary group. For example, rotating a temporary group of objects in its entirety.
To cancel a temporary grouping of objects, click outside the selection handles displayed around the objects.
A permanent grouping of objects can be created after selecting objects using one of the following methods:
Go to Shape > Group > Group on the Menu bar.
Right-click on the selected objects and select Group in the context menu.
Use the keyboard shortcut Ctrl+Shift+G (macOS ⌘+Shift+G)
When deselected, the objects remain grouped together. Any editing operations carried out on the group are applied to all objects within the group. If one object in the group is clicked, the whole group is selected.
Editing an individual within a group can be carried out without ungrouping or breaking the group. After selecting the group, use one of the following methods to enter the group:
Go to Shape > Group > Enter Group on the Menu bar.
Right-click on the selected group and select Enter Group in the context menu.
Use the keyboard shortcut F3.
Double-click on the selected group.
When editing is finished on an individual object within a group, use one of the following methods to exit the group:
Go to Shape > Group > Exit Group on the Menu bar.
Right-click and select Exit Group in the context menu.
Use the keyboard shortcut Shift+F3 (macOS ⌘+F3).
To ungroup or break apart a permanent group of objects, use one of the following methods:
Go to Shape > Group > Ungroup on the Menu bar.
Right-click and select Ungroup in the context menu.
Use the keyboard shortcut Ctrl+Alt+Shift+G (macOS ⌥+⌘+Shift+G).
A group of groups, more commonly known as nested groups, can be created. When nested groups are created, Draw retains the individual group hierarchy and remembers the order in which groups were selected. That is, the last individual group selected will be on top of all the other groups within a nested group. Ungrouping and entering a nested group work in the same way as for individual groups.
Combining is a permanent merging of objects, creating a new object. The original objects are no longer available as individual entities and cannot be edited as individual objects. Any editing of a combined object affects all the objects that were used when combination was carried out. For more information on combining objects, see the Draw Guide.
After selecting the objects for combining, use one of the following methods to create a new object. Combined objects are shown in Example (2) in Figure 44.
Go to Shape > Combine on the Menu bar.
Right-click on the objects and select Shapes > Combine in the context menu.
Use the keyboard shortcut Ctrl+Shift+K (macOS ⌘+Shift+K).
After selecting several objects, the Merge, Subtract, and Intersect functions become available. These functions are similar to combining objects, but allow the creation of a differently shaped object from the selected objects. The shape of the object depends on which function used. See the Draw Guide for more information on how to use these functions.
In Draw, selected objects can be arranged, aligned, and distributed in relation to each other. See the Draw Guide for more information on arranging and aligning objects.
Arrange the position of an object by moving it either forward or backward in relation to the order of objects.
Align objects with respect to each other using Left, Centered, or Right for horizontal alignment and Top, Center, or Bottom for vertical alignment.
Distribute objects so that the space between each of the objects is the same.
Draw contains a number of functions for editing images (also called pictures, raster graphics, or bitmaps). These functions include the import and export of images, and conversion from one image format to another. For more information on working with images, see Chapter 5, Working with Images and Graphics in this guide and the Draw Guide.
Draw includes a large range of filters so that it can read and display several image file formats. It also includes several tools for working with images, but does not have the same functionality as specialized programs, for example GIMP, or Adobe Photoshop.
Images can be added from several sources:
Directly from a scanner (Insert > Media > Scan on the Menu bar).
Created by another program, for example photographs from a digital camera (Insert > Image on the Menu bar).
The LibreOffice Gallery. For more information see Chapter 5, Working with Images and Graphics.
Draw saves images as drawings in the Open Document Format (ODF). To save an image or the entire file in another format, go to File > Export on the Menu bar and select a format in the drop‑down list. The image formats that Draw can export in and save to are listed in Appendix B, Open Source, Open Standards, OpenDocument.
Draw files can also be exported in HTML, XHTML, or PDF format. The HTML export uses a conversion wizard that creates as many web pages as there are pages in a document. Optionally drawing pages can be displayed in frames with a navigator and an index page. For more information about file formats, see Chapter 10, Working with File Formats, Security, and Exporting.
Draw does not match the functionality of specialized drawing, or image editing programs. However, it is capable of producing and editing good 3D drawings. For more information, see the Draw Guide.
Create a 3D object in Draw using one of the following methods:
Select a 3D shape in the 3D Objects panel in the Shapes deck on the Sidebar.
Select a 3D shape in the 3D Objects toolbar.
Click on the down triangle ▼ next to 3D-Objects in the Drawing toolbar and select a 3D shape from the pop-up sub-toolbar.
Right-click on a 2D object and select Convert > To 3D, or To 3D Rotation Object in the context menu.
Right-click on a 2D object and select Format > 3D Effects on the Menu bar.
Using layers when creating complex drawings makes a drawing easier to navigate and edit. Placing a drawing that is part of a complex drawing into its own layer makes editing easier. Any area of a layer that does not contain a drawing object is transparent and does not obscure any part of a complex drawing. Any number of layers can be added to a drawing. For more information on layers, see the Draw Guide.
A drawing in LibreOffice contains three default layers that cannot be deleted or renamed:
Layout — is the default Workspace where objects are normally placed when a drawing is created.
Controls — used for form controls that have been assigned an action. Objects on this layer are always in front of objects on other layers.
Dimension Lines — is where the dimension lines are drawn. By switching the layer to show or hide, dimension lines can be switched on or off.
A layer can be set to one or all of the following attributes:
Visible or hidden
Printable or not printable
Locked or unlocked
To quickly toggle the attributes for a selected layer, use the following keyboard shortcuts:
Shift+click — toggle between a layer being visible or hidden.
Ctrl+click (macOS ⌘+click) — toggle between a layer being locked or unlocked.
Ctrl+Shift+click (macOS ⌘+Shift+click) — toggle between a layer being printed or not printed.
Use one of the following methods to open the Insert Layer dialog (Figure 45):
Go to Insert > Layer on the Menu bar.
Right-click on the layer tabs at the bottom of the Workspace and select Insert Layer in the context menu.
Enter a meaningful Name, Title, and Description for the new layer in the text boxes.
Select Visible if the layer is to be visible in a drawing. When Visible is not selected, the layer is hidden and its name in the layer tab changes color to blue.
Select Printable if the layer is to be printed when a drawing is printed. Not printing is useful if a draft layer is required for guides or annotations that are used in making a drawing, but do not appear in the final output. The name of a layer is underlined in the layer tab bar when the Printable option is not selected.
Figure 45: Insert Layer dialog
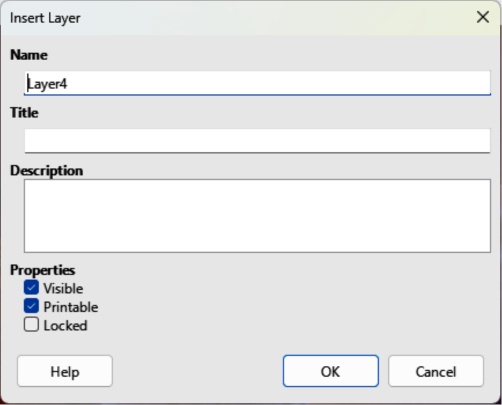
Figure 46: Modify Layer dialog
Select Locked to prevent any objects on this layer from deletion, editing, or moving. No additional objects can be added to a locked layer. Locking a layer is useful, for example, when a base plan is to be protected while adding a new layer with other details. The name of a locked layer is written in Italics in the layer tab bar.
Click OK to create the new layer and close the Insert Layer dialog. A new layer automatically becomes active when added to a drawing.
Note
Layers are added to the drawing in the order that they were inserted. The layer order cannot be changed.
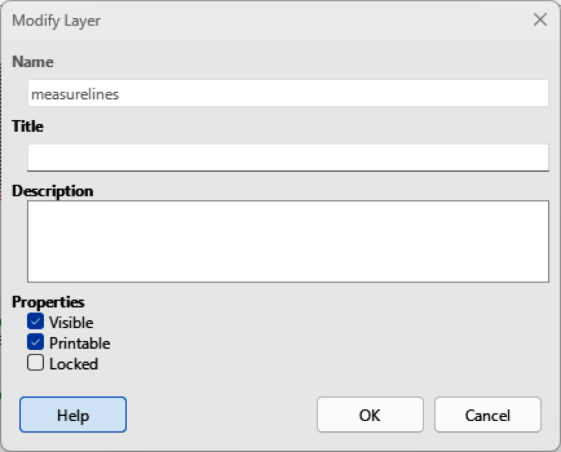
To modify a layer, use one of the following methods to open the Modify Layers dialog (Figure 46), which is similar in layout and options to the Insert Layers dialog.
Right-click on the name tab of the layer and select Modify Layer in the context menu.
Double-click on the layer tab.
Go to Format > Layer on the Menu bar.
Make the required changes to the layer, then click OK to save the changes and close the Modify Layers dialog.
Colors are selected using a Color palette, the Area and Line panels on the Properties deck of the Sidebar, and tools on the Line and Filling, and Drawing toolbars.
Note
For a more detailed description of the options available for Color palettes and custom colors, as well as more information on the difference between the CMYK and RGB Color schemes, refer to the Draw Guide.
The Color Bar allows quick selection of a color for an area, background, or lines of selected objects in a drawing. To display the Color Bar (Figure 47), go to View > Color Bar on the Menu bar. To close the Color Bar, go to View on the Menu bar and deselect Color Bar.
Left-click on a color to change the area or background color of a selected object.
Right-click on a color to change the color of lines in a selected object.
Left-click on the box with the X at the bottom left of the Color Bar to select no color for the area, or background of a selected object.
Figure 47: Color Bar
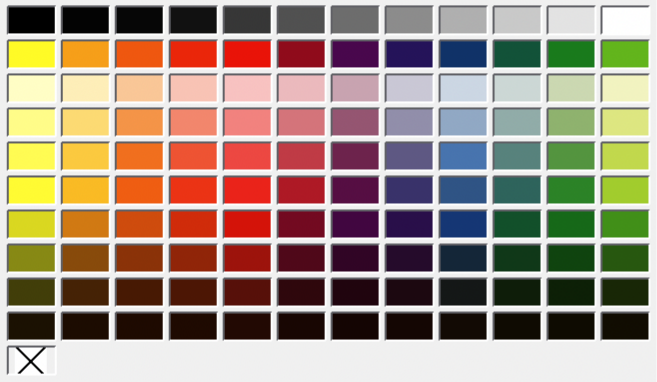
Right-click on the box with the X at the bottom left of the Color Bar to select no color for the lines of a selected object.
In the Area and Line panels in the Properties deck on the Sidebar (Figure 48), the color of an area or line of a selected object can be changed.
Select an object in a drawing.
Click on Properties on the Sidebar.
In the Properties deck, open the Area and/or Line panels by clicking on the triangle ▼ on the panel title bar.
Change the color of an area in the Area panel as follows:
Select Color in the Fill drop-down list.
Figure 48: Area and Line panels in Properties deck on Sidebar
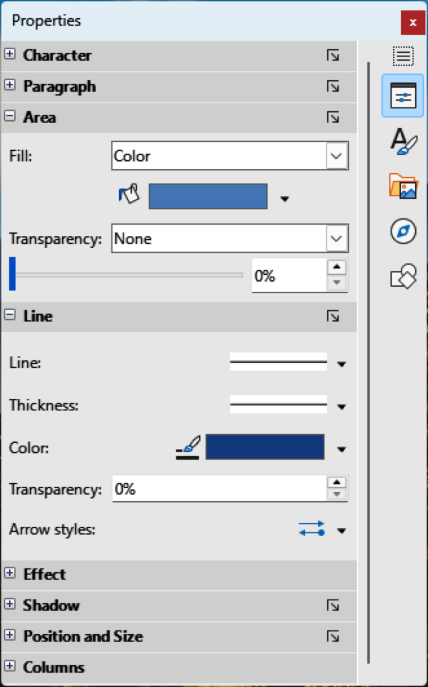
Click on the triangle ▼ next to the Fill Color box to open a drop-down list of available color palettes.
Select the required color palette from the options available.
Click on the required color to change the area color.
Change the color of a line in the Line panel as follows:
Click on the triangle ▼ next to the Line Color box to open a drop-down list of available color palettes.
Select the required color palette from the options available.
Click on the required color to change the line color.
The Line and Filling, and Drawing toolbars have similar tools that can be used to change the color of an area (fill) or line — Fill Color and Line Color. These tools are used in a similar way as changing colors using the Area and Line panels on the Properties deck of the Sidebar.
Adding comments to a drawing uses a similar process to the one used in Writer and Calc. For more about adding, navigating, and replying to comments, see Chapter 4, Getting Started with Writer.
Before using comments, make sure that name and initials are entered into Tools > Options > LibreOffice > User Data (macOS LibreOffice > Preferences > LibreOffice > User Data). The name and initials then appears in the comment marker and in the author field of the comment.
If more than one person edits the document, each author is automatically allocated a different background color. Go to View > Comments on the Menu bar to show or hide the comment markers.
Figure 49: Example comment in Draw
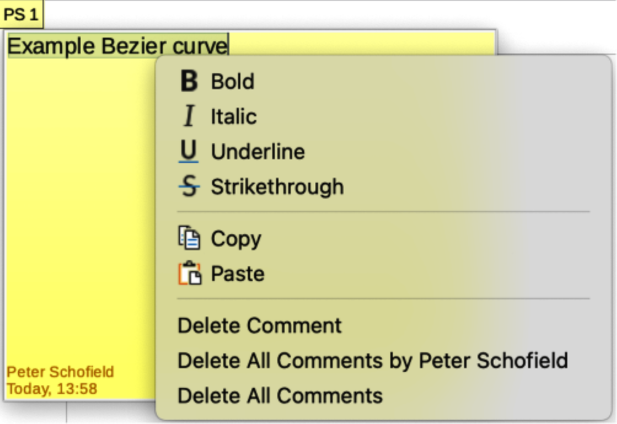
Go to Insert > Comment on the Menu bar. A small box containing the user initials appears in the upper left-hand corner of the drawing with a larger text box beside it (Figure 49). Draw automatically adds the name and the date at the bottom of this text box.
Type or paste comments into the text box.
If necessary, click and drag the small comment markers to move the comment to a different position on the drawing. Normally, the comment marker is placed on or near the object referred to in the comment.
Right-click on the comment and choose an option from the context menu to carrying out the following:
Delete the current comment.
Delete all the comments from the same author.
Delete all the comments in the document.
Carry out basic text formatting on the comment.s