Copyright
This document is Copyright © 2026 by the LibreOffice Documentation Team. Contributors are listed below. This document may be distributed and/or modified under the terms of either the GNU General Public License (https://www.gnu.org/licenses/gpl.html), version 3 or later, or the Creative Commons Attribution License (https://creativecommons.org/licenses/by/4.0/), version 4.0 or later. All trademarks within this guide belong to their legitimate owners.
Contributors
To this edition
Peter Schofield
To previous editions
Jean Hollis Weber, Kees Kriek, Michel Zarri, Peter Schofield, Rachel Karch, Samantha Hasmilton, T. Elliot Turner.
Feedback
Please direct any comments or suggestions about this document to the Documentation Team Forum at https://community.documentfoundation.org/c/documentation/loguides/ (registration is required) or send an email to: loguides@community.documentfoundation.org.
-
Note
Everything sent to a forum, including email addresses and any other personal information that is written in the message, is publicly archived and cannot be deleted. Emails sent to the forum are moderated.
Publication date and software version
Published August 2026. Based on LibreOffice 26.2 Community.
OLE Objects
Object Linking and Embedding (OLE) is software technology that allows linking and embedding of various file types into an Impress presentation, as follows:
-
LibreOffice spreadsheets
-
LibreOffice charts
-
LibreOffice drawings
-
LibreOffice formulas
-
LibreOffice text
The major benefit of using OLE objects is to provide a quick and easy method of editing an object using tools from the software that created the object. These file types are created using LibreOffice and OLE objects can be created from new or from an existing file.
Inserting new OLE objects
-
Select the slide in a presentation where the OLE object is going to be inserted.
-
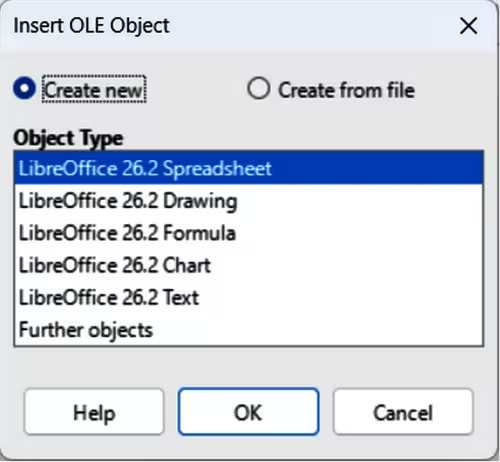
Go to Insert > OLE Object > OLE Object on the Menu bar to open the Insert OLE Object dialog (Figure 1).
-
Select Create new and then select the type of OLE object in Object Type.
-
Click OK and a new OLE object is inserted in the center of the slide in edit mode. The toolbars change to display the necessary tools for creating a new OLE object.
Figure 1: Insert OLE Object dialog — Create new page
Inserting OLE objects from files
-
Select the slide in a presentation where the OLE object is going to be inserted.
-
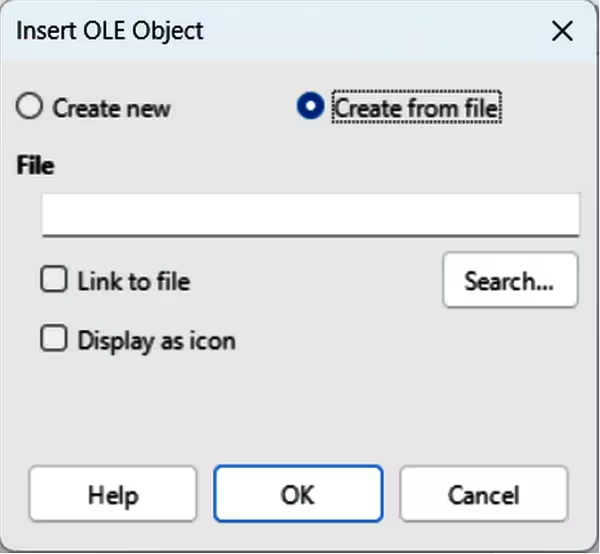
Go to Insert > OLE Object > OLE Object on the Menu bar to open the Insert OLE Object dialog (Figure 2).
-
Select Create from file, then click on Search and a file browser window opens.
Figure 2: Insert OLE Object dialog — Create from file page
-
Navigate to where the file is located, then select the file required and click Open. The filename appears in the File text box in the Insert OLE Object dialog.
-
Insert the OLE object into the center of the slide in edit mode using one of the following methods:
-
Click OK to insert the file as an OLE object.
-
Select Link to file, then click OK to insert the OLE object into using a link to original file.
-
Select Display as icon, then click OK to insert the OLE object as an icon. When the icon is clicked on, the OLE object opens in a new window.
Editing OLE objects
-
Double-click on the OLE object to open it in edit mode. The toolbars in Impress change to provide the necessary tools for editing an OLE object.
-
When editing the OLE object is complete, click anywhere outside the OLE object to exit editing.
-
Save the presentation. Any changes made to the OLE object are also saved.
-
Notes
When inserting a new OLE object, it is only available in the presentation it has been inserted into. Inserted OLE objects can only be edited using Impress.
By default, when inserting a file into a slide as an OLE object, any changes made to the original file do not affect the copy of the file inserted into a presentation. Also, changes to the OLE object in a presentation do not change the original file. If any changes made to the file, either in the original or in the presentation, are to be visible in both versions, the original file has to be linked with the presentation when the file is inserted as an OLE object.
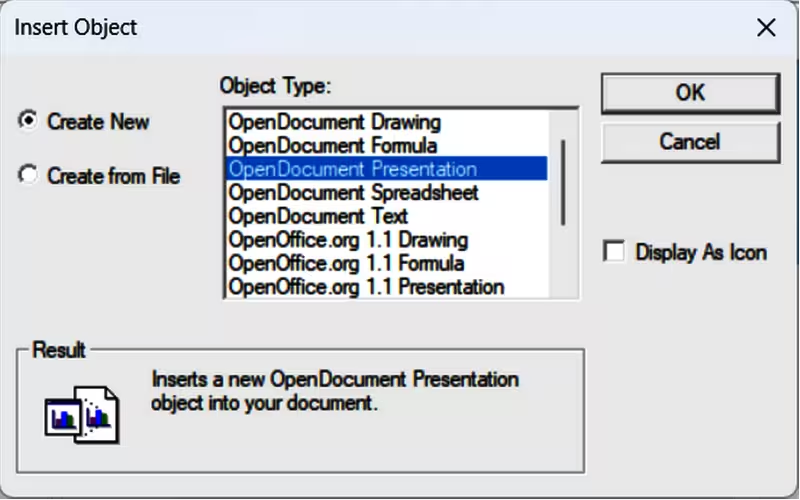
For computers using the Windows operating system, an additional option of Further objects is available in the Object Type list. Clicking on Further objects opens the Insert Object dialog (Figure 3), which allows the insertion of an OLE object compatible with both OLE and LibreOffice. This option is available for new OLE objects and OLE objects from a file.
Figure 3: Insert OLE Object dialog — Create New Further Objects page
Resizing and moving OLE objects
Resizing and moving OLE objects is exactly the same as resizing and moving graphic objects in Impress. For more information, see Chapter 5, Managing Graphic Objects.
Spreadsheets
To incorporate spreadsheets into an Impress presentation, either insert an existing spreadsheet file, or insert a new spreadsheet as an OLE object. For more information on spreadsheets, see the Calc Guide and the Getting Started Guide.
Embedding a spreadsheet into Impress includes most of the functionality of a Calc spreadsheet, such as enabling calculations and data analysis. However, if complex data or formulas are to be used, it is recommended to perform those operations in a separate Calc spreadsheet first, then embed the spreadsheet into Impress with the results.
-
Notes
When resizing or moving a spreadsheet in slides, ignore any horizontal and vertical scroll bars, and the first row and first column. The first row and column are easily recognizable because of their light background color. They are only used for spreadsheet editing purposes and are not included in the spreadsheet that appears as an OLE object on the slide.
Do not double click on an OLE spreadsheet object when moving or resizing. Double clicking opens the OLE object editing mode for spreadsheets.
While spreadsheets can be used in Impress for creating tables or presenting data in a tabular format, inserting a table into Impress is often more suitable and quicker, depending on the complexity of the data. See Chapter 3, Adding and Formatting Text for more information on inserting and formatting tables.
When embedding a spreadsheet, the entire spreadsheet is inserted into a slide as an OLE object. If the spreadsheet contains multiple sheets and the sheet required is not visible, simply double-click the spreadsheet and select a different sheet from the sheet tab row.
Editing spreadsheets
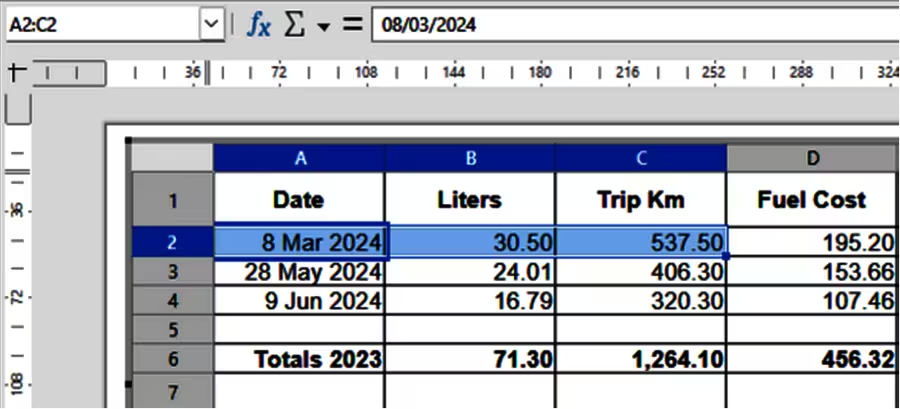
When a spreadsheet is inserted into a slide, it is in edit mode ready for inserting or modifying data or modifying the format (Figure 4). The following also happens to provide tools and functions for spreadsheets:
Figure 4: Example of OLE spreadsheet editing in Impress
-
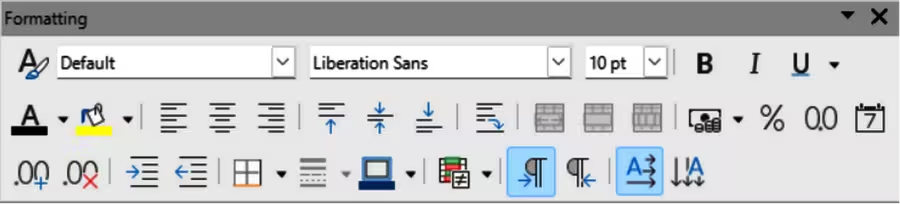
The Formatting toolbar for spreadsheets (Figure 5) opens replacing the Line and Filling toolbar and the following tools become available at the top of the OLE spreadsheet for basic formatting:
Figure 5: Formatting toolbar
-
Name Box — shows the active cell reference or the name of a selected range of cells.
-
Function Wizard; Select Function; Formula.
-
Input Line — edit box for entering data or reviewing displayed contents of an active cell. If necessary, click on the triangle ▼ on the right of the cell to expand the edit box. This provides space for functions that require multiple lines.
-
The Menu bar also changes providing formatting options used for editing spreadsheets.
Cell navigation
When an embedded spreadsheet is opened, the default active cell is A1. To move in a spreadsheet, select a cell to activate the cell using one of the following methods:
-
Keyboard arrow keys.
-
Position the cursor in a cell and click.
-
Press the Enter key to move one cell down and Shift+Enter combination to move one cell up.
-
Press the Tab key to move one cell to the right and Shift+Tab combination to move one cell to the left.
-
Note
Other keyboard shortcuts are available to navigate in a spreadsheet. Refer to Getting Started Guide or the Calc Guide for more information.
Entering data
Data input into a cell can only be carried out when a cell is active. An active cell is easily identified by a thickened and bolder border. The cell reference for the active cell is displayed in the Name Box at the left hand end of the Calc editing toolbar.
-
Double-click on the embedded spreadsheet to open editing mode.
-
Select a cell to make it active and start typing in the cell, or in the Input Line. Entering data into the Input Line makes the data entry easier to read.
-
Use the various tools and options on the Menu bar to enter data, formula, function, text, or date into a cell.
-
To confirm data input into a cell use one of the following methods:
-
Select a different cell with the cursor.
-
Press the Enter key, or the Shift+Enter key combination.
-
Press the Tab key, or Shift+Tab key combination.
-
When editing the embedded spreadsheet is complete, click anywhere outside the border to exit edit mode and save the changes.
-
Tip
When entering numbers as text, for example telephone numbers. Impress automatically removes any leading zeros from the number. To prevent Impress from removing leading zeros, or right aligning numbers in a cell, type a single quotation mark before entering a number as text, for example ‘1234.
Merging cells
-
Double-click on the embedded spreadsheet to open editing mode.
-
Highlight the required number of cells to be merged.
-
If no data in the cells is being merged, use one of the following methods to merge cells:
-
Go to Format > Merge and Unmerge Cells > Merge and Center Cells on the Menu bar.
-
Go to Format > Merge and Unmerge Cells > Merge Cells on the Menu bar.
-
Right-click on the selected cells and select Merge Cells from the context menu.
-
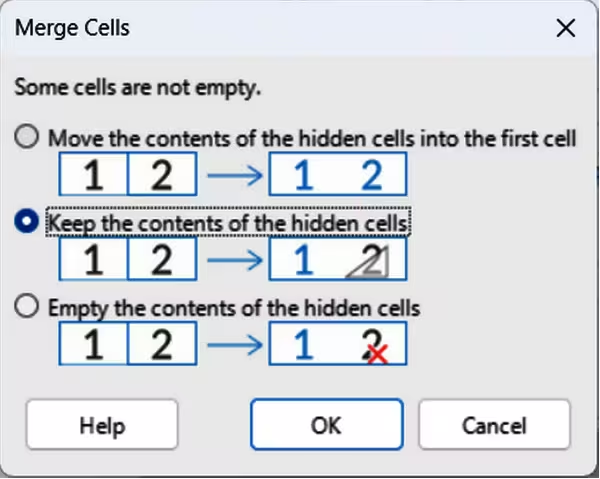
If the selected cells for merging contain data, the Merge Cells dialog (Figure 6) automatically opens. Merge the selected cells as follows:
-
Use one of the methods in Step 3 to merge cells and open the Merge Cells dialog.
-
Select an option in the Merge Cells dialog.
-
Click OK to merge the cells and close the Merge Cells dialog.
Figure 6: Merge Cells dialog
-
When editing an embedded spreadsheet has been completed, click anywhere outside the border to exit edit mode and save the changes.
Splitting merged cells
Only multiple cells that have been merged can be split, or unmerged, into separate cells.
-
Double-click on the embedded spreadsheet to open editing mode.
-
Select a cell that was formed from merging from multiple cells.
-
Split the merged cell into separate cells using one of the following methods:
-
Go to Format > Merge and Unmerge Cells > Unmerge Cells on the Menu bar.
-
Right-click on the cell and select Unmerge Cells from the context menu.
-
When editing the embedded spreadsheet is complete, click anywhere outside the border to exit edit editing mode and save the changes.
Inserting cells
-
Double-click on the embedded spreadsheet to open editing mode.
-
Select the same number of cells on the embedded spreadsheet going to be inserted.
-
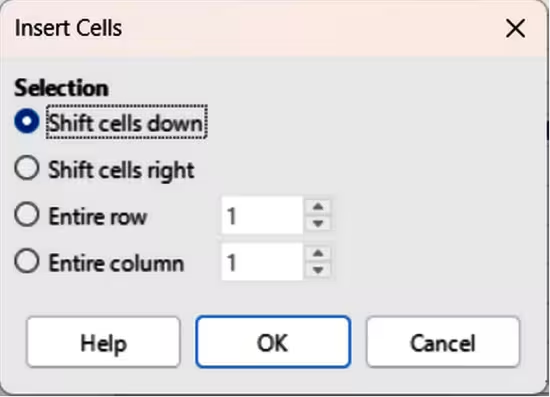
Insert cells using one of the following methods. Inserting cells opens the Insert Cells dialog (Figure 7).
-
Go to Sheet > Insert Cells on the Menu bar.
-
Right-click on the selected cells and select Insert from the context menu.
-
Use the keyboard shortcut Ctrl++ (macOS ⌘++).
-
Select an insert option for cells, then click OK to insert the cells and close the Insert Cells dialog.
-
When editing an embedded spreadsheet is complete, click anywhere outside the border to exit edit editing mode and save the changes.
Figure 7: Insert Cells dialog
Inserting rows
-
Double-click on the embedded spreadsheet to open editing mode.
-
Select the same number of rows on the embedded spreadsheet that are going to be inserted.
-
Insert rows using one of the following methods:
-
Go to Sheet > Insert Rows > Rows Above or Sheet > Insert Rows > Rows Below on the Menu bar.
-
Right-click on the row header for the selected rows and select Insert Rows Above or Insert Rows Below from the context menu.
-
Open the Insert Cells dialog (Figure 7) and select Entire row to insert rows above the selected rows.
-
When editing the embedded spreadsheet is complete, click anywhere outside the border to exit edit editing mode and save the changes.
Inserting columns
-
Double-click on the embedded spreadsheet to open editing mode.
-
Select the same number of columns on the embedded spreadsheet that are going to be inserted.
-
Insert columns using one of the following methods:
-
Go to Sheet > Insert Columns > Columns Before or Sheet > Insert Columns > Columns After on the Menu bar.
-
Right-click on the column header for the selected columns and select Insert Columns Before or Insert Columns After from the context menu.
-
Open the Insert Cells dialog (Figure 7) and select Entire column to insert columns to the left of the selected columns.
-
When editing the embedded spreadsheet is complete, click anywhere outside the border to exit edit editing mode and save the changes.
Deleting cells
-
Double-click on the embedded spreadsheet to open editing mode.
-
Select the cells on the embedded spreadsheet that are going to be deleted.
-
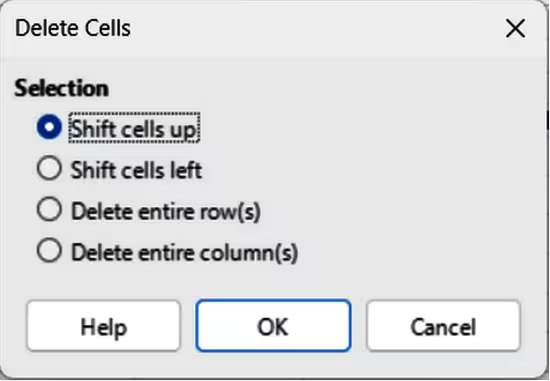
Delete the selected cells using one of the following methods. Deleting cells opens the Delete Cells dialog (Figure 8).
-
Go to Sheet > Delete Cells on the Menu bar.
-
Right-click on the selected cells and select Delete from the context menu.
-
Use the keyboard shortcut Ctrl+- (macOS ⌘+-).
Figure 8: Delete Cells dialog
-
Select a delete option in the Delete Cells dialog, then click OK to delete the cells and close the dialog.
-
When editing the embedded spreadsheet is complete, click anywhere outside the border to exit edit editing mode and save the changes.
Deleting rows
-
Double-click on the embedded spreadsheet to open editing mode.
-
Select the rows for deletion on the embedded spreadsheet.
-
Delete the selected rows using one of the following methods:
-
Go to Sheet > Delete Rows on the Menu bar.
-
Right-click in the row header for the selected rows and select Delete Rows from the context menu.
-
Open the Delete Cells dialog (Figure 8) and select Delete entire row(s).
-
When editing the embedded spreadsheet is complete, click anywhere outside the border to exit edit editing mode and save the changes.
Deleting columns
-
Double-click on the embedded spreadsheet to open editing mode.
-
Select the columns for deletion on the embedded spreadsheet.
-
Delete the selected columns using one of the following methods:
-
Go to Sheet > Delete Columns on the Menu bar.
-
Right-click in the column header for the selected columns and select Delete Columns from the context menu.
-
Open the Delete Cells dialog (Figure 8) and select Delete entire column(s).
-
When editing the embedded spreadsheet is complete, click anywhere outside the border to exit edit editing mode and save the changes.
Quickly inserting sheets
-
Double-click on the embedded spreadsheet to open editing mode.
-
Quickly insert a sheet using one of the following methods:
-
Click on the plus sign to the left of the sheet names and a new sheet is added to the spreadsheet after the last sheet in the spreadsheet.
-
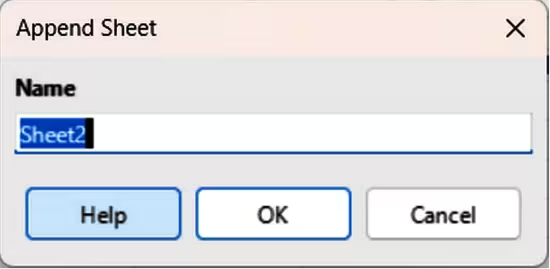
Go to Sheet > Insert Sheet at End on the Menu bar and enter a name for the sheet in the Append Sheet dialog (Figure 9) that opens, then click OK. A new sheet is added to the spreadsheet after the last sheet in the spreadsheet.
-
When editing the embedded spreadsheet is complete, click anywhere outside the border to exit edit editing mode and save the changes.
-
Note
If there are multiple sheets in an embedded spreadsheet, only the active sheet is shown on the slide after exiting edit mode.
Figure 9: Append Sheet dialog
Inserting sheets
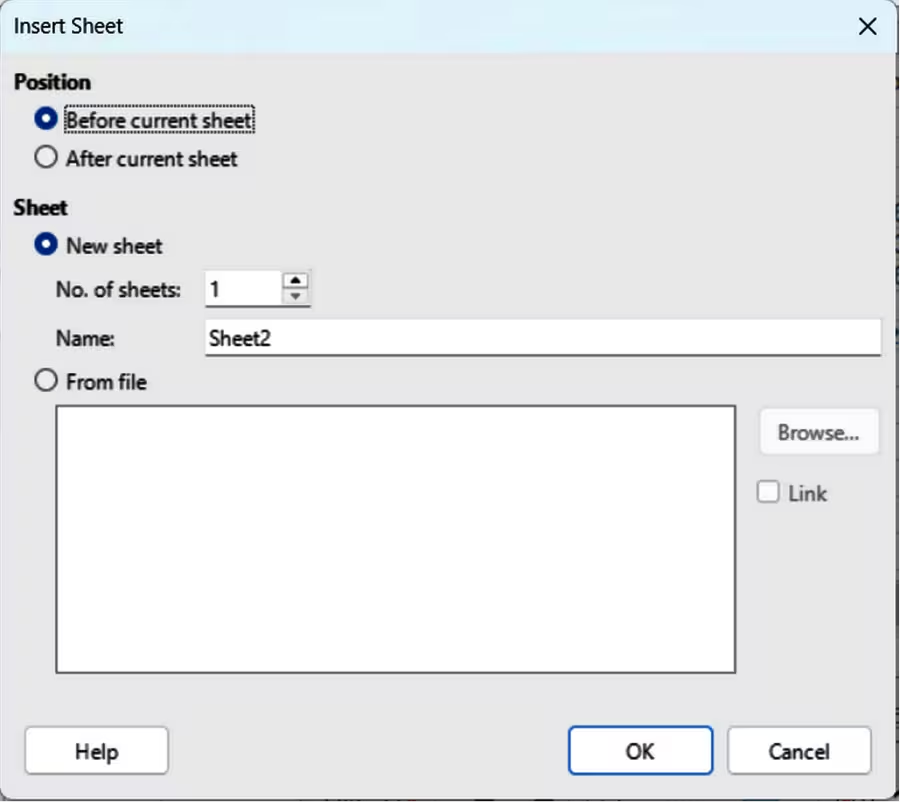
For more control over inserting sheets into an embedded spreadsheet, use the Insert Sheet dialog (Figure 10) as follows:
-
Double-click on the embedded spreadsheet to open editing mode.
-
Open the Insert Sheet dialog using one of the following methods:
-
Right-click on the sheet names and select Insert Sheet from the context menu.
-
Go to Sheet > Insert Sheet on the Menu bar.
-
In Position, select one of the following options:
-
Before current sheet — inserts sheets before the active sheet in the spreadsheet.
-
After current sheet — inserts sheets after the active sheet in the spreadsheet.
-
In Sheet, select New sheet and the No. of sheets required.
-
In the Name text box, enter a name for the new sheet. This option is not available if inserting multiple sheets.
-
Click OK to insert the sheet and close the Insert Sheet dialog.
-
When editing the embedded spreadsheet is complete, click anywhere outside the border to exit edit editing mode and save the changes.
Figure 10: Insert Sheet dialog
Insert sheet from file
When inserting a sheet from a file, the Insert Sheet dialog (Figure 10) has to be used.
-
Double-click on the embedded spreadsheet to open editing mode.
-
Open the Insert Sheet dialog using one of the following methods:
-
Right-click on the sheet names and select Insert Sheet from the context menu.
-
Go to Sheet > Insert Sheet on the Menu bar.
-
In Position, select one of the following options:
-
Before current sheet — inserts sheets before the active sheet in the spreadsheet.
-
After current sheet — inserts sheets after the active sheet in the spreadsheet.
-
In Sheet, select From file and click on Browse to open an Insert browser window.
-
Navigate to the file location and select the file.
-
Click on Open and the sheet names contained in the file appear in the preview box.
-
If required, click on Link to create a link to the original file.
-
Select the sheet required for insertion in the preview box.
-
Click OK to insert the selected sheet into the embedded spreadsheet and close the Insert Sheet dialog.
-
When editing the embedded spreadsheet is complete, click anywhere outside the border to exit edit editing mode and save the changes.
Renaming sheets
-
Double-click on the embedded spreadsheet to open editing mode.
-
Select the sheet for renaming to make it active.
-
Right-click on the sheet tab and select Rename Sheet from the context menu, or go to Sheet > Rename Sheet on the Menu bar.
-
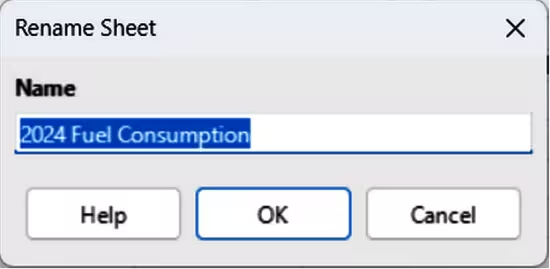
Enter a new name for the sheet in the Rename Sheet dialog (Figure 11) that opens.
Figure 11: Rename Sheet dialog
-
Click OK to save the name change and close the Rename Sheet dialog.
-
When editing the embedded spreadsheet is complete, click anywhere outside the border to exit edit editing mode and save the changes.
Moving or copying sheets
-
Double-click on the embedded spreadsheet to open editing mode.
-
Select the sheet for moving or copying to make it active.
-
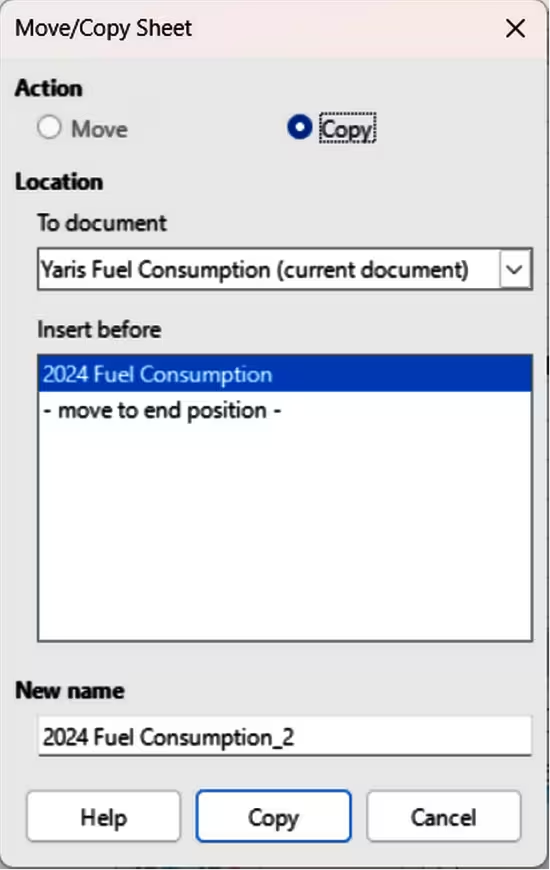
Right-click on the sheet tab and select Move or Copy Sheet from the context menu, or go to Sheet > Move or Copy Sheet on the Menu bar to open the Move/Copy Sheet dialog (Figure 12).
-
Move or copy a sheet to another position within the embedded spreadsheet in the same presentation as follows:
-
In Action, select Move or Copy option.
-
In Location, select a destination from the options in the To document drop-down list. In Impress, the presentation is named as Untitled 1 (current document).
-
In Insert before, select the position within the spreadsheet from the available list.
-
If necessary, enter a new name for the sheet in the New name text box.
-
Click on Move to move the sheet, or Copy to copy the sheet and close the Move/Copy sheet dialog.
-
Move or copy a sheet to another document containing a spreadsheet is as follows:
-
Make sure the spreadsheet in the target document is selected.
-
In Action, select Move or Copy option.
-
In Location, select a destination from the options in the To document drop-down list. In Impress, the presentation is named as Untitled 1 (current document). If the document is a Calc spreadsheet, the filename of the LO Calc spreadsheet is displayed.
-
In Insert before, select the position within the spreadsheet from the available list.
-
If necessary, enter a new name for the sheet in the New name text box.
Figure 12: Move/Copy Sheet dialog
-
Click on Move to move the sheet, or Copy to copy the sheet and close the Move/Copy sheet dialog.
-
To move the sheet within the embedded spreadsheet using the cursor, click on the sheet tab and drag the selected sheet to a new position.
-
When editing the embedded spreadsheet is complete, click anywhere outside the border to exit edit editing mode and save the changes.
-
Note
To move or copy a sheet from an embedded spreadsheet in an Impress presentation into another document, then the target document must be a Calc spreadsheet or a document that can contain an embedded spreadsheet.
Deleting sheets
-
Double-click on the embedded spreadsheet to open editing mode.
-
Select the sheet for deletion to make it active.
-
Right-click on the sheet tab and select Delete Sheet from the context menu, or go to Sheet > Delete Sheet on the Menu bar.
-
Click Yes to confirm the deletion of the sheet.
-
When editing the embedded spreadsheet is complete, click anywhere outside the border to exit edit editing mode and save the changes.
Formatting spreadsheets
For presentation purposes, it may be necessary to change the formatting of a spreadsheet to match the style used in the presentation.
When working on an embedded spreadsheet, any styles created in Calc are also available for use. However, if styles are going to be used, it is recommended to create specific styles for embedded spreadsheets. Calc styles maybe unsuitable when working in Impress.
Cell data formatting
-
Select a cell or a range of cells in an embedded spreadsheet using one of the following methods:
-
Click in a cell to select it.
-
To select the whole sheet, click on the blank cell at the top left corner between the row and column headers.
-
To select the whole sheet, use the keyboard shortcut Ctrl+A (macOS ⌘+A).
-
To select a column, click on the column header at the top of the spreadsheet.
-
To select a row, click on the row header on the left hand side of the spreadsheet.
-
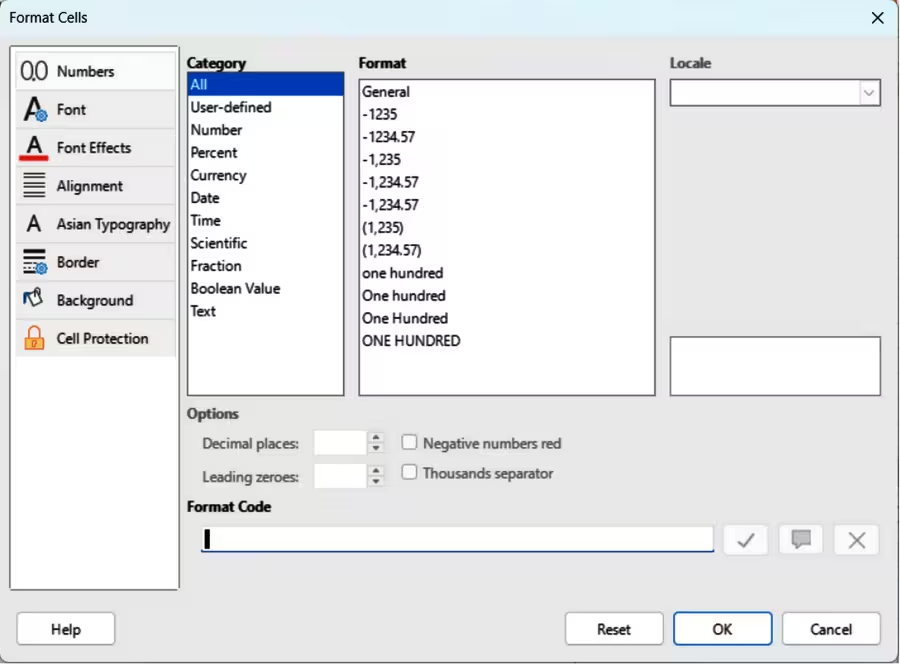
Open the Format Cells dialog (Figure 13) using one of the following methods:
-
Right-click on a cell and select Format Cells from the context menu.
-
Go to Format > Cells on the Menu bar.
-
Use the keyboard shortcut Ctrl+1 (macOS ⌘+1).
Figure 13: Format Cells dialog
-
Use the various pages in the Format Cells dialog to format the cell data so that it matches the style of the presentation.
-
Click OK to close the Format Cells dialog and save the formatting changes.
-
When editing the embedded spreadsheet is complete, click anywhere outside the border to exit edit editing mode and save the changes.
Row formatting
-
Select a row by clicking in the row header.
-
Adjust the row height using one of the following methods:
-
Right-click in the row header and select Row Height from the context menu to open the Row Height dialog, then enter the required row height in the Height text box.
-
Right-click in the row header and select Row Height from the context menu to open the Row Height dialog, then select Default value for row height.
-
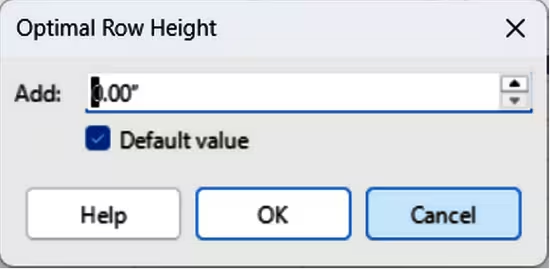
Right-click in the row header and select Optimal Height from the context menu to open the Optimal Height dialog (Figure 14). Enter an optimal height in the Add text box, or select Default value. The optimal row height depends on the font size of the largest character in a row.
-
Move the cursor over the bottom border in the row header until the cursor changes shape, then click and drag the border to increase or decrease the row height.
Figure 14: Optimal Row Height dialog
-
When editing the embedded spreadsheet is complete, click anywhere outside the border to exit edit editing mode and save the changes.
Column formatting
-
Select a column by clicking in the column header.
-
Adjust the column width using one of the following methods:
-
Right-click in the column header and select Column Width from the context menu to open the Column Width dialog, then enter the required column width in the Width text box.
-
Right-click in the column header and select Column Width from the context menu to open the Column Width dialog, then select the Default value for column width.
-
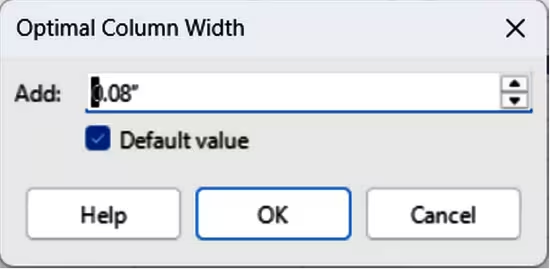
Right-click in the column header and select Optimal Width from the context menu to open the Optimal Column Width dialog (Figure 15). Enter an optimal width in the Add text box, or select Default value. The optimal column width depends on the longest entry within a column.
-
Move the cursor over the left or right border in the column header until the cursor changes shape, then click and drag the border to increase or decrease the column width.
Figure 15: Optimal Column Width dialog
-
When editing the embedded spreadsheet is complete, click anywhere outside the border to exit edit editing mode and save the changes.
Using formatting styles
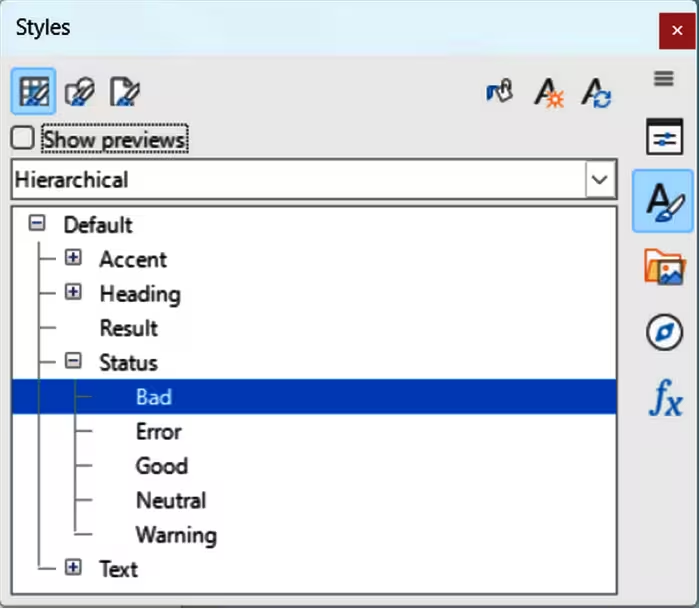
When using styles in an embedded spreadsheet and the spreadsheet is in edit mode, Impress displays the available styles for a spreadsheet in the Cell Styles panel in the Styles deck on the Sidebar (Figure 16). Styles used in an embedded spreadsheet are similar to LibreOffice paragraph styles.
-
Select the data in a cell or cells in the embedded spreadsheet.
-
Click on Styles to open the Styles deck in the Sidebar, then click on Cell Styles to open the Calc styles panel.
-
Double-click on a style to apply that style to the cell data.
-
When editing the embedded spreadsheet is complete, click anywhere outside the border to exit edit editing mode and save the changes.
Figure 16: Sidebar Styles deck — Cell Styles panel
Charts
A chart is a graphical interpretation of information that is contained in a spreadsheet. The following information only provides basic information on charts. For more information about creating charts and the use of charts, see the Calc Guide.
Inserting charts
-
Select a slide to insert a chart.
-
Use one of the following methods to insert a chart:
-
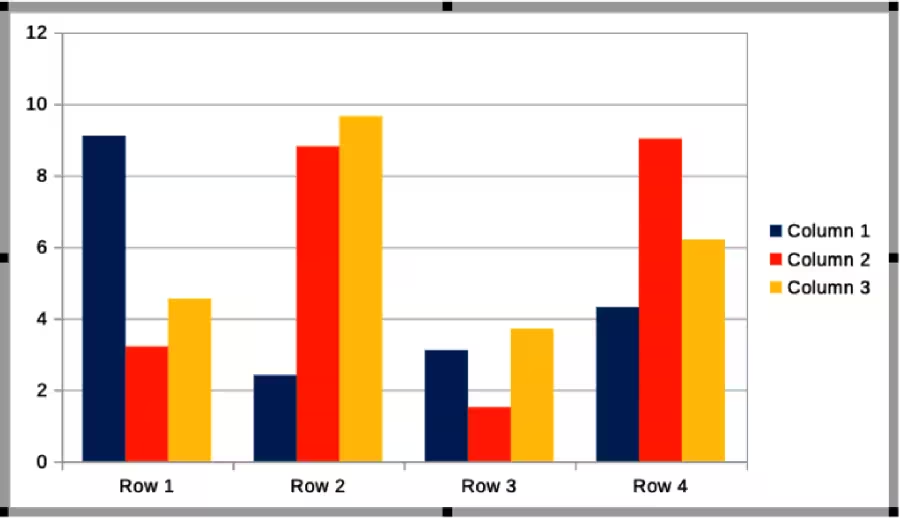
Go to Insert > Chart on the Menu bar and an example chart (Figure 17) is inserted at the center of the selected slide in editing mode.
-
Click on Insert Chart on the Standard toolbar and an example chart is inserted in the center of the slide in editing mode.
-
Go to Insert > Object > OLE Object on the Menu bar to insert a chart as an OLE object.
Figure 17: Example chart in editing mode
-
If necessary, click outside the chart area to cancel editing mode.
-
Note
When an embedded chart is in editing mode, the Formatting toolbar (Figure 18) for charts and a Standard toolbar for charts (Figure 19) automatically open replacing the Line and Filling, and Standard toolbars.
Figure 18: Chart Formatting toolbar
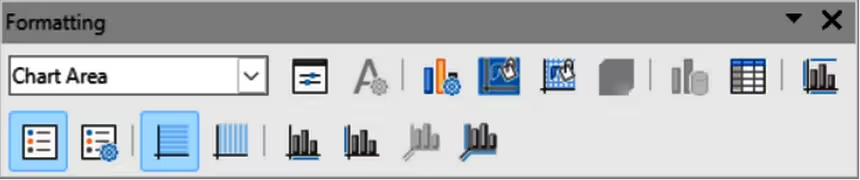
Figure 19: Standard toolbar editing charts
Selecting chart types
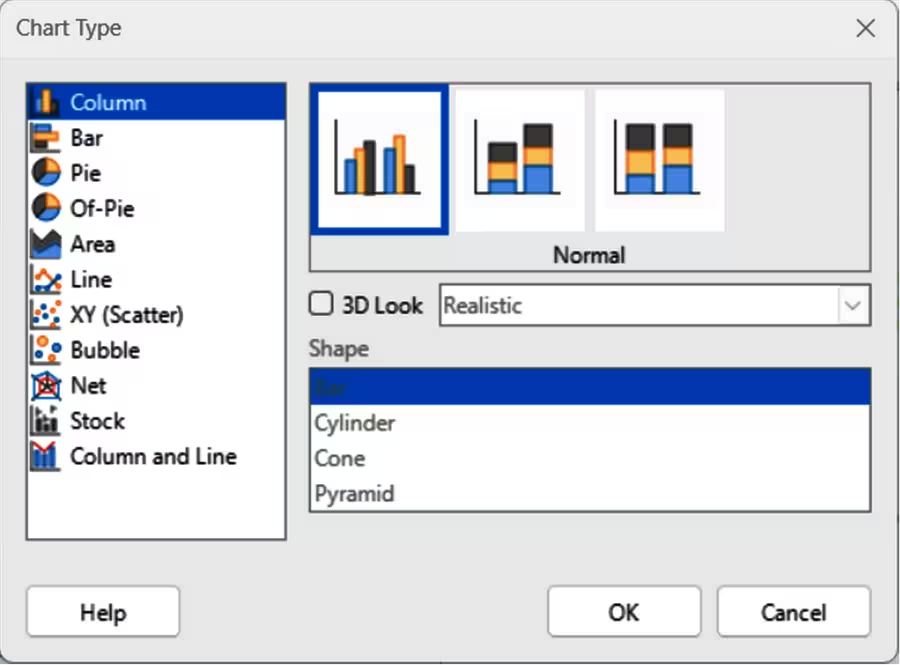
Data can be presented using a variety of different chart types. Impress contains several examples of chart types that will convey information to an audience. Select a chart type using the Chart Type dialog (Figure 20).
-
Make sure the chart is selected and in editing mode. The chart has a border and selection handles when in editing mode.
-
Open the Chart Type dialog using one of the following methods:
-
Click on Chart Type on the Formatting toolbar.
-
Go to Format > Chart Type on the Menu bar.
-
Right-click on the chart and select Chart Type from the context menu.
Figure 20: Chart Type dialog
-
Select a chart type from the left-hand preview box and the chart examples on the right change. The available options for chart types change to match the selected chart type.
-
Select a chart example from the right-hand preview box.
-
Select the options required for the chart type selected.
-
Click OK to close the Chart Type dialog and return to the edit window.
-
Continue to format the chart, add data to the chart, or click outside the chart to return to normal view.
Chart types
The following summary of available chart types to help selection of a chart type suitable for the data being used to create the chart. Column, bar, pie and area charts are available as 2D or 3D types. For more information on charts, see the Calc Guide.
Column
Bar
Pie
Area
Line
XY (Scatter)
Bubble
Net
Stock
Column and line
Formatting charts
Entering chart data
-
Make sure the chart is selected and in editing mode. The chart has a border and selection handles when in editing mode.
-
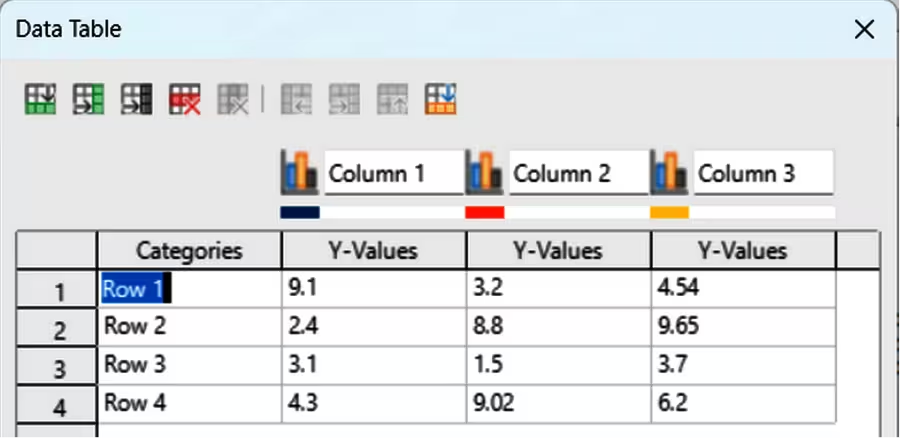
Open the Data Table dialog (Figure 21) using one of the following methods:
-
Click on Data Table on the Formatting toolbar for charts.
-
Go to View > Data Table on the Menu bar.
-
Right-click on the chart and select Data Table from the context menu.
-
Type or paste information into the cells to enter data into the Data Table dialog.
-
Use the tools in the top of the Data Table dialog to insert, delete or reposition rows or columns.
-
Click on Close to save the changes and close the Data Table dialog.
-
When formatting the chart is complete and all the data has been added to the chart, click outside the chart to deselect editing and return to normal view.
Figure 21: Data Table dialog
-
Notes
To insert, delete or reposition a column, use the tools Insert Series, Delete Series, Move Series Left, and Move Series Right in the Data Table dialog.
The method selected to add an element changes the type of element that can be added to the chart. Also, when adding some elements to the chart, a dialog may open with more options for the element being added.
Adding or removing chart elements
-
Make sure the chart is selected and in editing mode. The chart has a border and selection handles when in editing mode.
-
Add an element to the chart using one of the following methods:
-
Go to Insert on the Menu bar and select an element from the submenu.
-
Right-click directly on the chart and select an element from the context menu.
-
Right-click directly on the chart wall and select an element from the context menu.
-
Remove an element from a chart using one of the following methods:
-
Right-click on the chart element and select the delete option from the context menu. Type of element selected changes delete options in the context menu.
-
Select a chart element and press the Delete or Backspace key to remove the element from the chart.
-
When formatting the chart is complete and all the data has been added to the chart, click outside the chart to return to deselect editing and return to normal view.
Chart and chart elements formatting
For more information on formatting a chart, chart elements, and the formatting options available, see the Calc Guide.
-
Make sure the chart is selected and in editing mode. The chart has a border and selection handles when in editing mode.
-
Format an element on the chart using one of the following methods:
-
Go to Format on the Menu bar and select an element for formatting.
-
Right-click on an element and select Format XXXX from the context menu. The format option available depends on which chart element has been selected. For example, if the chart wall is selected, the format option is called Format Wall and the Chart Wall dialog opens displaying the available options.
-
Use the various tools on the Formatting toolbar for charts to format a chart element.
-
Select an element and open a formatting dialog specific for the element selected.
-
Use the various options in the formatting dialog to format the element.
-
When formatting the chart is complete and all the data has been added to the chart, click outside the chart to return to deselect editing and return to normal view.
Resizing and moving charts
A chart and its chart elements can be resized and moved just like other objects on a slide. For more information on resizing and moving a chart, see Chapter 5, Managing Graphic Objects and the Calc Guide.
Audio and video
Inserting audio or video
-
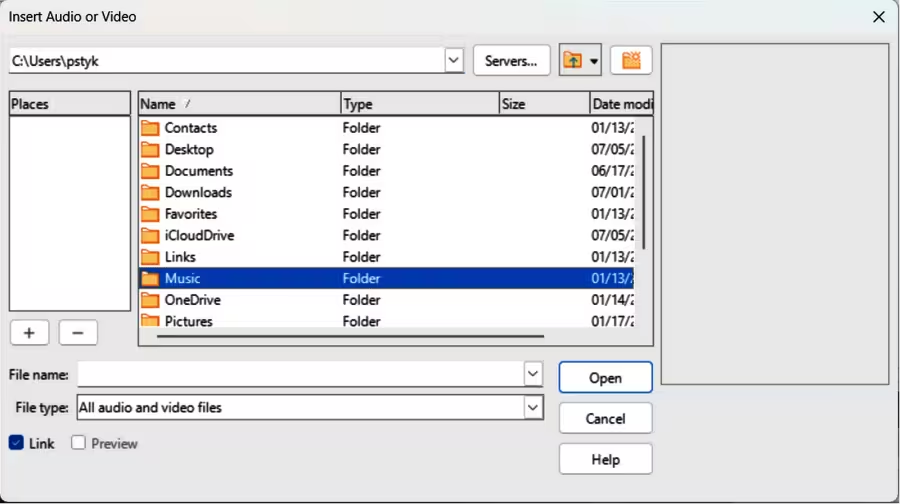
Go to Insert > Audio or Video on the Menu bar and a file browser for Insert Audio or Video opens (Figure 22).
Figure 22: Insert Audio or Video dialog
-
Navigate to the folder where the audio or video file is located. Only audio and video files that are compatible with Impress are available in the file browser.
-
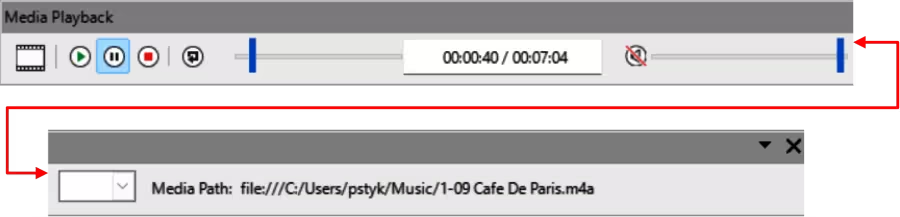
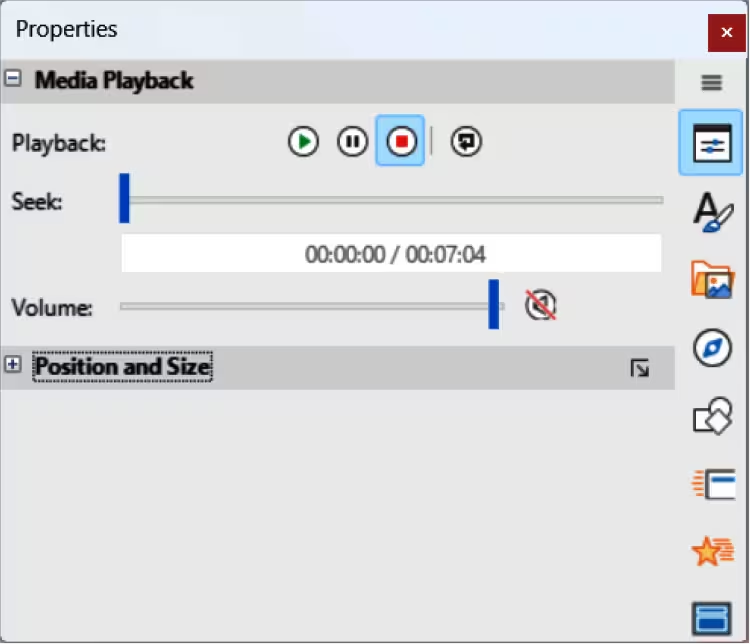
Select a compatible audio or video file and click Open to embed the file in the center of the slide. The Media Playback toolbar (Figure 23) and the Media Playback panel in the Properties deck on the Sidebar (Figure 24) automatically open.
Figure 23: Media Playback toolbar
-
Reposition and/or resize the audio or video file. See Chapter 5, Managing Graphic Objects for more information.
Media playback
The Media Playback toolbar (Figure 23) and Media Playback panel in the Sidebar Properties deck (Figure 24) automatically open when an audio or video file is selected providing tools to control the playback of a media file.
Figure 24: Sidebar Properties deck — Media Playback panel
Formulas
-
Note
Unlike formulas in Writer, a formula in Impress is treated as an object and is not automatically aligned with the rest of the objects on the slide. The formula can be moved around like other objects in Impress, but cannot be resized.
Formulas are inserted onto a slide as an OLE object. For more information on how to create and edit formulas, see the Math Guide or the Getting Started Guide.
Go to Insert > OLE Object > Formula Object on the Menu bar to create a formula in a slide and the following happens:
-
The Menu bar changes to provide tools for editing and formatting a formula.
-
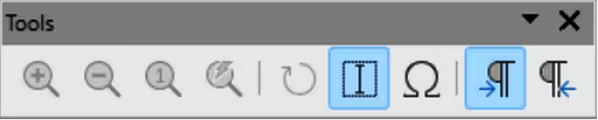
The Tools toolbar (Figure 25) opens providing tools to help create and edit a formula.
Figure 25: Tools toolbar
-
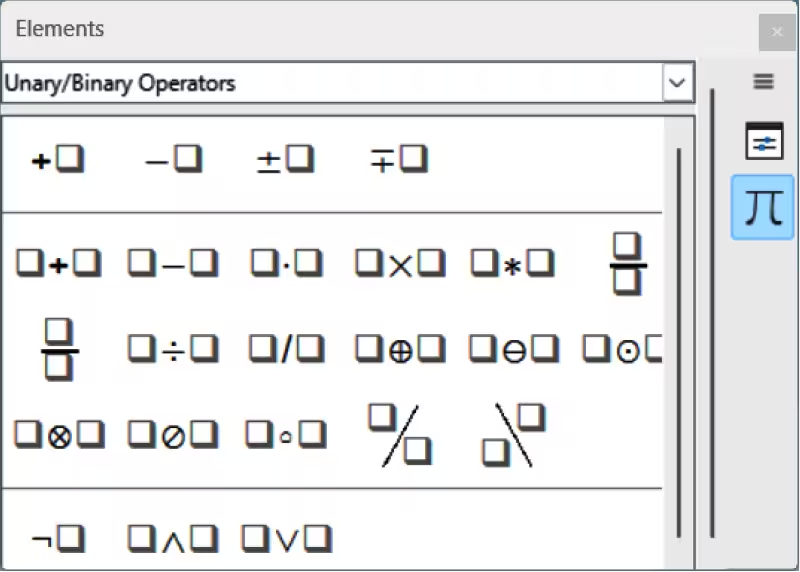
The Elements deck in the Sidebar (Figure 26) opens allowing selection of element categories from the drop‑down list and formula elements from the available options.
Figure 26: Elements deck in Sidebar
When creating formulas, care should be taken with font sizes to make sure formulas are similar in size to the font used in the presentation. To change font attributes of a formula, go to Format > Font Size on the Menu bar. To change font type, go to Format > Fonts on the Menu bar.
Drawings, text files, HTML files and other objects
Drawings, text files, HTML files and other objects that are compatible with Impress can be inserted into an Impress presentation.
-
Go to Insert > File on the Menu bar to open a file selection dialog. Only files compatible with Impress are available for selection and insertion as OLE Objects.
-
Copy and insert as an OLE objects compatible drawings, text files, HTML files, or object.