
Writer Guide 7.3
Chapter 19,
Spreadsheets, Charts, Other Objects
This document is Copyright © 2022 by the LibreOffice Documentation Team. Contributors are listed below. You may distribute it and/or modify it under the terms of either the GNU General Public License (https://www.gnu.org/licenses/gpl.html), version 3 or later, or the Creative Commons Attribution License (https://creativecommons.org/licenses/by/4.0/), version 4.0 or later.
All trademarks within this guide belong to their legitimate owners.
|
Jean Hollis Weber |
|
|
|
Jean Hollis Weber |
Felipe Viggiano |
Kees Kriek |
|
Bruce Byfield |
Gillian Polack |
|
Please direct any comments or suggestions about this document to the Documentation Team’s mailing list: documentation@global.libreoffice.org
Note
Everything you send to a mailing list, including your email address and any other personal information that is written in the message, is publicly archived and cannot be deleted.
Published March 2022. Based on LibreOffice 7.3.
Some keystrokes and menu items are different on macOS from those used in Windows and Linux. The table below gives some common substitutions for the instructions in this document. For a detailed list, see the application Help.
|
Windows or Linux |
macOS equivalent |
Effect |
|
Tools > Options |
LibreOffice > Preferences |
Access setup options |
|
Right-click |
Control+click or right-click depending on computer setup |
Open a context menu |
|
Ctrl (Control) |
⌘ (Command) |
Used with other keys |
|
Alt |
⌥ (Option) or Alt, depending on keyboard |
Used with other keys |
|
F11 |
⌘+T |
Open Styles deck in Sidebar |
You can embed or link objects as either OLE (Object Linking and Embedding) or DDE (Dynamic Data Exchange). Both methods enable you to use information from one application (say, Calc) in another application (Writer, in this case). The difference between a DDE object and a linked OLE object is that a linked OLE object can be edited from the document in which it is added as a link, but a DDE object cannot.
For example, if a Calc spreadsheet is pasted into a Writer document as a DDE object, then the spreadsheet cannot be edited in the Writer document. But if the original Calc spreadsheet is updated, the changes are automatically made in the Writer document. If the spreadsheet is inserted as a Linked OLE object into the Writer document, then the spreadsheet can be edited in Writer as well as in the Calc document and both documents are in sync with each other.
Both linking and embedding insert information from one document into another document, but the methods store information differently. They are different from directly copying and pasting information because you can open and edit objects in the applications that created them.
An embedded OLE object is a copy of information from another document. When you embed objects, there is no link to the source document and any changes made to the source document are not reflected in the destination document. Embed objects if you want to be able to use the application that created them for editing, but you do not want the OLE object to be updated when you edit information in the source document.
A linked object is a reference to information in another document. Link objects when you want to use the same information in more than one document. Then, if you change the original information, you need to update only the links in order to update the document containing the OLE objects. You can also set links to be updated automatically. When you link an object, you need to maintain access to the source application and the linked document. If you rename or move either of them, you may need to reestablish the link.
The following types of files or documents can be inserted into a Writer document as an OLE object: spreadsheets, charts, drawings, formulas (equations), and presentations.
When you insert a new OLE object into a document, it is embedded; that is, the object is available only in that document and can only be edited using Writer.
To insert a new OLE object into a document:
1) Click where you want to insert the object.
2) Choose Insert > Object > OLE Object on the Menu bar.
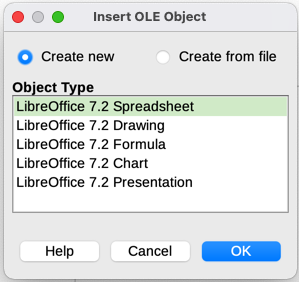
3) On the Insert OLE Object dialog (Figure 1), select Create new.
4) Select the type of object you want to create and click OK.
5) A new OLE object is inserted in the document in edit mode. The toolbars displayed in Writer will change, providing the necessary tools for you to create the new OLE object.
Note
Computers running Microsoft Windows show an additional option of Further Objects in the Object Type list. This option opens a dialog where you can create an OLE object using other software that is compatible with OLE and LibreOffice. This option is available for new OLE objects and for OLE objects from another file.
Figure 1: Inserting a new OLE object
When you insert an existing file (for example, a spreadsheet) into a Writer document as an OLE object, you can choose whether to embed or link the file.
1) Click where you want to insert the file and choose Insert > Object > OLE Object on the Menu bar.
2) On the Insert OLE Object dialog, select Create from file. The dialog changes to show a File text box (Figure 2).
Figure 2: Inserting an OLE object from a file
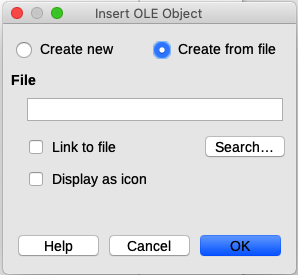
3) Click Search to open a file browser.
4) Locate the file you want to insert and click Open.
To insert the file as a live link so that any changes made are synchronized in both the original file and your document, select the Link to file option.
To show a selectable icon for the application that created the file (in this case, Calc), instead of displaying the contents of the file, select the Display as icon option.
5) Click OK to insert the file as an OLE object.
To edit an OLE object after it has been created or inserted from a file:
1) Double-click the OLE object to open it in edit mode. The toolbars displayed in Writer will change to provide the tools necessary to edit the object.
2) When you finish editing the object, click anywhere outside the object to exit edit mode.
3) Save the Writer document. Any changes made to the OLE object are also saved.
If the OLE object is linked, then if you change it in Writer it will change in Calc; if you change it in Calc, it will change in Writer. This can be a very powerful tool if you create reports in Writer using Calc data, and want to make a quick change without opening Calc.
To create a DDE link from Calc to Writer:
1) Open both the Writer document and the Calc spreadsheet.
2) In Calc, select the cells to make the DDE link to. Copy them.
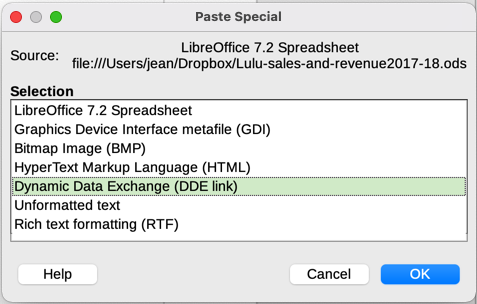
3) Go to the place in your Writer document where you want the DDE link. Select Edit > Paste Special > Paste Special. Writer displays its Paste Special dialog (Figure 3).
4) Select the Dynamic Data Exchange (DDE link) option in the Selection list.
5) Click the OK button. Now the link has been created in Writer. When the Calc spreadsheet is updated, the table in Writer is automatically updated.
Figure 3: Paste Special dialog in Writer, with DDE link selected
To include a spreadsheet in a Writer document, you can insert either an existing spreadsheet file or a new spreadsheet as an OLE object, as explained above, or create a DDE (Dynamic Data Interchange) object.
Embedding a spreadsheet into Writer includes most of the functionality of a Calc spreadsheet. Writer is capable of performing complex calculations and data analysis. However, if you plan to use complex data or formulas, it is recommended to perform those operations in a separate Calc spreadsheet and use Writer only to display the embedded spreadsheet with the results.
You may be tempted to use spreadsheets in Writer for creating complex tables or presenting data in a tabular format. However, the Table feature in Writer is often more suitable and faster to use, depending on the complexity of your data; see Chapter 13, Tables of Data.
To embed a spreadsheet into a Writer document, follow the instructions in “Inserting a file as an OLE object” above.
When an entire spreadsheet is inserted into a document, if it contains more than one sheet and the one you want is not visible, double-click the spreadsheet, and then select a different sheet from the row of sheet tabs at the bottom.
When selected, a spreadsheet object is treated like any other object.
To resize the area occupied by the spreadsheet:
1) Click on the object to show the selection handles in the border.
2) Move the mouse pointer over one of the handles. The pointer changes shape to give a visual representation of the effects applied to the area.
3) Click and hold the left mouse button and drag the handle. The corner handles move the two adjacent sides simultaneously, while the handles at the midpoint of the sides modify one dimension at a time.
Moving a spreadsheet object to change its position within the document is the same as moving any other object in Writer:
1) Click on the object to show the selection handles in the border.
2) Move the cursor over the object until the cursor changes shape (normally a hand, but this depends on your computer setup). Be careful not to double-click the spreadsheet object and activate object editing mode.
3) Click and drag the object to the desired position. Release the mouse button.
To edit a spreadsheet object, double-click it, or select it and choose Edit > Object > Edit on the Menu bar, or right-click and choose Edit in the context menu.
You edit the object in its own frame within the Writer document, but some of the toolbars change in Writer. One of the most important changes is the presence of the Formula bar, which contains (from left to right):
The Name Box, that shows the active cell reference or the name of a selected range of cells.
The Function Wizard icon.
The Select Function and Formula icons or the Cancel and Accept icons, depending on the editing actions taken in the spreadsheet.
A long Input Line to enter or review the contents of the active cell.
If you are familiar with Calc, you will immediately recognize the tools and the menu items. See Chapter 5, Getting Started with Calc, in the Getting Started Guide for more information.
A spreadsheet consists of pages called sheets. However, in Writer, only one sheet can be shown at a time when a spreadsheet with multiple sheets is embedded into a Writer document.
Each sheet is organized into cells, which are the elementary units of the spreadsheet. They are identified by a row number (shown on the left-hand side) and a column letter (shown in the top row). For example, the top left cell is identified as A1, while the third cell in the second row is C2. All data elements, whether text, numbers, or formulas, are entered into a cell.
Note
If the embedded spreadsheet has multiple sheets, only the active sheet is shown on the page after exiting edit mode.
You can insert, rename, delete, and edit sheets in an embedded spreadsheet. To begin, double-click the embedded spreadsheet to open it in edit mode. When you finish editing the embedded spreadsheet, click anywhere outside the border to exit edit mode and save the changes.
Tip
For more details on these procedures, refer to Chapter 5, Getting Started with Calc, in the Getting Started Guide.
1) Right-click a sheet name and select Insert Sheet in the context menu, or go to Sheet > Insert Sheet on the Menu bar to open the Insert Sheet dialog.
2) Select the sheet position, number of sheets to be inserted, sheet name, or which spreadsheet file to use from the options available in the Insert Sheet dialog.
3) Click OK to close the dialog and insert the sheet.
1) Right-click the sheet name and select Move or Copy Sheet in the context menu, or go to Sheet > Move or Copy Sheet on the Menu bar to open the Move/Copy Sheet dialog.
2) Select whether to move or copy the sheet, the sheet location and position, and a new sheet name. Click OK to close the dialog and move or copy the sheet.
3) Alternatively, click the sheet tab and drag it to a new position in the embedded spreadsheet.
1) Right-click the sheet tab and select Delete Sheet in the context menu, or go to Sheet > Delete Sheet on the Menu bar. If the spreadsheet has only one sheet remaining, you cannot delete that sheet.
2) Click Yes to confirm.
To move around the spreadsheet to select a cell to make it active, you can:
Use the keyboard arrow keys.
Position the cursor in a cell and left-click the mouse.
Use the Enter key to move one cell down and Shift+Enter to move one cell up.
Use the Tab key to move one cell to the right and Shift+Tab to move one cell to the left.
Data input into a cell can only be done when a cell is active. An active cell is easily identified by a thickened and bolder border. The cell reference (or coordinates) for the active cell is displayed at the left-hand end of the Formula bar.
1) Select the cell to make it active and start typing. The data input is also displayed in the Input line on the Formula toolbar, making the data entry easier to read.
2) Use the Function Wizard, Select Function, and Formula icons to enter data, formulas, or functions into a cell. If the input is not a formula (for example, a text or date entry), the Select Function and Formula icons change into the Cancel and Accept icons.
3) To confirm data input into a cell, either select a different cell, or press the Enter key, or click the Accept icon on the Formula bar.
Writer normally recognizes the type of contents (text, number, date, time, and so on) entered into a cell and applies default formatting to it. However, if Writer wrongly recognizes the type of data you have entered into a cell:
1) Select the cell, then right-click it and select Format Cells in the context menu, or go to Format > Cells on the Menu bar, or use the keyboard shortcut Ctrl+1.
2) In the Format Cells dialog, click the appropriate tab to open the correct page and use the options on that page to format the cell data.
3) Click OK to close the dialog and save your changes.
Tip
To force Writer to treat numbers as text (for example, telephone numbers) and to prevent Writer from removing the leading zeros or right-align them in a cell, type a single quotation mark (') before entering the number.
It may be necessary to change the formatting of a spreadsheet to match the style used in the document.
When working on an embedded spreadsheet, you can also access any cell styles created in Calc and use them. However, if you are going to use styles, it is recommended to create specific cell styles for embedded spreadsheets, as Calc cell styles may be unsuitable when working within Writer.
To manually format an embedded spreadsheet:
1) Select a cell or a range of cells. See Chapter 5, Getting Started with Calc, in the Getting Started Guide for more information on selecting ranges of cells.
2) Right-click the selection and go to Format Cells in the context menu, or go to Format > Cells on the Menu bar, or use the keyboard shortcut Ctrl+1 to open the Format Cells dialog.
3) Use the various dialog pages to format the embedded spreadsheet so that it matches the style of your document.
4) Click OK to close the dialog and save your changes.
5) If necessary, adjust the column width by hovering the mouse over the line separating two columns in the header row until the mouse cursor changes to a double-headed arrow; then click the left button and drag the separating line to the new position.
6) If necessary, adjust the row height by hovering the mouse over the line separating two rows in the row header until the mouse cursor changes to a double-headed arrow; then click the left button and drag the separating line to the new position.
7) When you are satisfied with the formatting changes, click outside the spreadsheet area to save your changes and exit edit mode.
When an embedded spreadsheet is in edit mode, Writer displays the available styles for a spreadsheet in the Styles deck in the sidebar.
If a style you want to use is not available, you can create it (see Chapter 8, Introduction to Styles). Styles used in an embedded spreadsheet are similar to paragraph styles used in Writer.
To use styles in your embedded spreadsheet, open the Styles deck in the Sidebar, then select data in a cell and double-click a style in the Styles deck to apply it.
To insert rows or columns in an embedded spreadsheet:
1) Select the column or row where you want the new column or row inserted.
2) Go to Sheet on the Menu bar and select either Insert Columns > Columns Before, or Insert Columns > Columns After, or Insert Rows > Rows Above, or Insert Rows > Rows Below.
Or, right-click the column or row header and select Insert Columns Before, Insert Columns After, Insert Rows Above, or Insert Rows Below in the context menu.
To delete rows or columns from an embedded spreadsheet:
1) Highlight the rows or columns that you want to delete.
2) Go to Sheet on the Menu bar and select Delete Rows or Delete Columns, or right-click and select Delete Columns or Delete Rows in the context menu.
1) Select the cells you want to delete.
2) Go to Sheet > Delete Cells, or press Ctrl+-. Or, right-click on a cell and select Delete in the context menu.
3) Select the option you require on the Delete Cells dialog.
To merge contiguous cells into a single cell:
1) Select the cells to be merged.
2) Right-click on the selected cells and select Merge Cells in the context menu, or go to Format > Merge Cells > Merge Cells or Merge and Center Cells on the Menu bar, or click on the Merge and Center Cells icon on the Formatting toolbar. Using Merge and Center Cells will center align any contents in the cells.
3) If the cells contain any data, a small dialog opens, showing choices for moving or hiding data in the hidden cells. Make your selection and click OK.
To split a group of cells that have been merged into a single cell:
1) Select the cell that contains merged cells.
2) Go to Format > Merge Cells > Split Cells or right-click and select Split Cells in the context menu. If the split cells contained data that was merged before, this data will not be split again.
Charts and graphs are graphical interpretations of data, often from a spreadsheet. For more information, see Chapter 3, Creating Charts and Graphs, in the Calc Guide.
You can add a chart to your document as an OLE object (see page above) or using the tools in Writer.
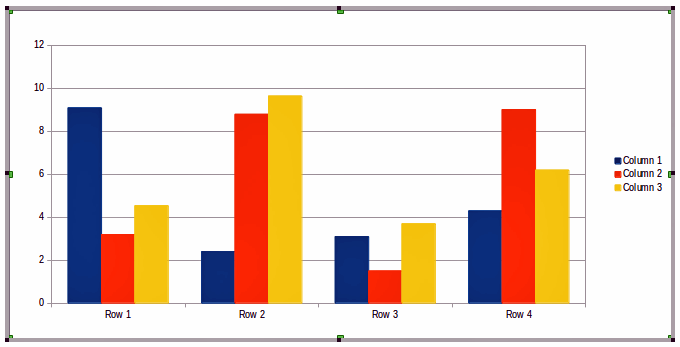
To add a chart using Writer’s tools, choose Insert > Chart on the Menu bar to insert a generic chart (Figure 4) at the cursor location. The chart is selected and the Menu bar and toolbars change to those appropriate for charts.
Figure 4: Chart with sample data
Your data can be presented using a variety of different charts. Writer contains several chart types that will help you convey your message to your audience. See “Chart types” below.
Figure 5: Chart Type dialog showing two-dimensional charts
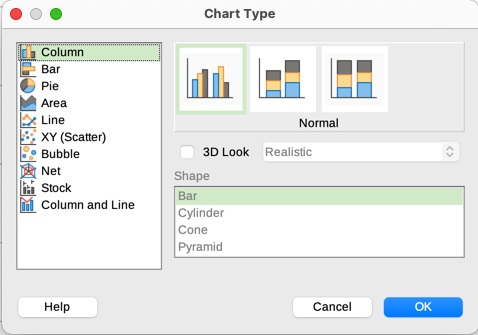
1) Make sure that the chart is selected. The chart has a border and selection handles when selected.
2) Click the Chart Type icon on the Formatting toolbar or go to Format > Chart Type on the Menu bar, or right-click the chart and select Chart Type in the context menu to open Chart Type dialog (Figure 5).
3) As you change selections in the left-hand list, the chart examples on the right change. You can move the Chart Type dialog to one side to see the effect in the chart.
4) As you change chart types, other selections become available on the right-hand side. For example, some chart types have both 3D and 2D variants. When 3D Look is selected, more options become available for selection of shapes for the columns or bars.
5) Choose the chart characteristics you want and click OK to save your changes and return to the edit window.
6) Continue to format the chart, add data to it, or click outside the chart to return to normal view.
The following summary of the chart types available will help you choose a type suitable for your data. Column, bar, pie, and area charts are available as 2D or 3D types. Examples of these types are given in detail in Chapter 3, Creating Charts and Graphs, in the Calc Guide.
Column charts
Bar charts
Pie charts
Area charts
Line charts
XY (Scatter) charts
Bubble charts
Net charts
Stock charts
Column and line charts
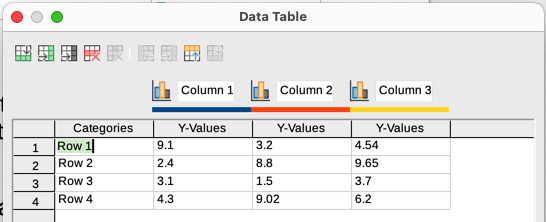
1) Select the chart and then select the chart type.
2) Click the Data Table icon, or select View > Data Table on the Menu bar, or right-click and select Data Table in the context menu to open the Data Table dialog (Figure 6).
3) Type or paste information into the cells within the desired rows and columns in the Data Table dialog. You can also use the icons in the top left corner of the Data Table dialog to insert, delete or move data.
Figure 6: Chart Data Table dialog
The specimen chart inserted into a document includes two elements: a chart wall and a chart legend (also known as the key). You can add or remove elements to or from a chart.
1) Make sure the chart is selected and in edit mode.
2) To add an element to the chart, go to Insert on the Menu bar and select an element in the submenu, or right-click the chart wall or a chart element and select an element in the context menu. Selecting an element opens a dialog where you can specify options for the element.
Note
Right-clicking on a chart element will give you more options to choose from when adding elements to a chart. The number of available insert options in the context menu depends on the type of element selected.
3) To remove an element from a chart, right-click the chart element you want to remove and select Delete in the context menu. The type of element selected for removal will change the delete options in the context menu. Or, select an element in the chart and press the Del (Delete) key or the Backspace key to remove it from the chart.
To change the format of a selected chart:
1) Make sure the chart is selected and in edit mode.
2) Go to Format on the Menu bar and select on the submenu an element that you want to format, or right-click a chart element and select a format option from the context menu. Selecting an element opens a dialog where you can specify format options for the element.
The formatting options available depend on whether the whole chart is selected or which chart element has been selected.
You can resize or move a chart interactively or by using the Position and Size dialog. You can also use a combination of both methods.
To resize a chart interactively:
1) Click a chart to select it. Selection handles appear around the chart.
2) To increase or decrease the height of a chart, click and drag on a selection handle at the top or bottom of the chart.
3) To increase or decrease the width of a chart, click and drag on a selection handle at the left or right of the chart.
4) To increase or decrease both the height and width of a chart at the same time, click and drag on a selection handle in one of the corners. To maintain the correct aspect ratio between height and width, hold the Shift key down while you click and drag.
To move a chart interactively:
1) Click the chart to select it. Selection handles appear around the chart.
2) Move the cursor anywhere on the chart other than on a selection handle.
3) When it changes shape, click and drag the chart to its new location.
4) Release the mouse button when the chart is in the desired position.
To resize or move a chart using the Position and Size dialog:
1) Double-click the chart so that it is in edit mode.
2) Go to Format > Position and Size on the Menu bar, or right-click the chart and select Position and Size in the context menu. For more information on using the Position and Size dialog, see Chapter 11, Images and Graphics.
Outside of the edit mode, it is possible to change the position and size of the chart in the Type page on the Properties dialog. Right-click on the chart and select Properties in the context menu.
You can move or resize individual elements of a chart element independently of other chart elements. For example, you can move the chart legend to a different position. Pie charts allow individual wedges of the pie to be moved as well as “exploding” the entire pie.
1) Double-click the chart so that it is in edit mode.
2) Click any chart element to select it. Selection handles appear.
3) Move the cursor over the selected element and when the cursor changes shape, click and drag to move the element.
4) Release the mouse button when the element is in the desired position.
Note
If the chart is 3D, round selection handles appear; these handles control the three-dimensional angle of the chart. You cannot resize or reposition the chart while the round selection handles are showing. Shift+click to get back to the square resizing handles. You can now resize and reposition the 3D chart.
The chart area is the area surrounding the chart graphic and includes the (optional) main title and key.
1) Double-click the chart so that it is in edit mode.
2) Go to Format > Chart Area on the Menu bar, or right-click in the chart area and select Format Chart Area in the context menu, or double-click in the chart area to open the Chart Area dialog.
3) Click the Area tab and select the button corresponding to the type of background fill you want to use. The available options will change depending on the type of fill selected.
4) Make your selections and click OK to close the dialog and save the changes.
The chart wall is the area that contains the chart graphic. Keep in mind that some chart types do not use a wall, like the pie chart for example.
1) Double-click the chart so that it is in edit mode.
2) Select the chart wall and go to Format > Format Selection on the Menu bar, or right-click in the chart wall and select Format Wall in the context menu, or double-click in the chart wall to open the Chart Wall dialog.
3) Click the Area tab and proceed as above.
4) Click OK to close the dialog and save the changes.
Although linked audio and video files are irrelevant when a Writer document is printed, if the document is opened on a computer or exported to PDF or HTML, you can play the files by clicking on the links.
To insert a media file into your document:
1) Choose Insert > Media > Audio or Video on the Menu bar to open the Insert Audio or Video dialog.
2) Select the media file to insert and click Open to place the object in the document.
Tip
To see a list of audio and video file types supported by Writer, open the drop-down list of file types. This list defaults to All audio and video files, so you can also choose unsupported files such as .mov.
Writer only links media files and does not embed a media file into a document. Therefore if a document is moved to a different computer, any links will be broken and the media files will not play. To prevent this from happening:
1) Place any media files that are included in a document in the same folder where the document is stored.
2) Insert the media file in the document.
3) Send both the document and any media files to the computer which is to be used for the document and place both files in the same folder on that computer.
To insert media clips directly from the Gallery:
1) Go to the Gallery deck on the Sidebar.
2) Browse to a theme containing media files (for example, Sounds).
3) Click the movie or sound to be inserted and drag it into the document area.
The Media Playback toolbar is automatically opened when a media file is selected. The default position of the toolbar is at the bottom of the workspace, just above the Drawing toolbar. However, this toolbar can be undocked and placed anywhere. If the toolbar does not open, go to View > Toolbars > Media Playback on the Menu bar.
The Media Playback toolbar contains the following tools:
Insert Audio or Video – opens the Insert Audio or Video dialog.
Play, Pause, Stop – controls media playback.
Repeat – if selected, media will continuously repeat playing until this tool is deselected.
Position (Playback slider) – selects the position to start playing from within the media file.
Timer – displays current position of the media clip and length of media file.
Mute – when selected, the sound will be suppressed.
Volume – adjusts the volume of the media file.
Media path – the location of the file on the computer.
View (Scaling drop-down menu) – only available for movies; allows scaling of the clip.
Go to Insert > Object > Formula on the Menu bar to create a formula (equation). A formula can also be inserted as an OLE object; see page above for more information.
To easily add numbered formulas in Writer, you can use the AutoText entry fn (for “formula numbered”):
1) Start a new line in your document.
2) Type fn and then press the F3 key. A two-column table with no borders is inserted into the document. The left column contains a sample formula and the right column contains a reference number, as shown below.
|
|
(1) |
3) Delete the sample formula and insert your formula as an object in the left column.
4) Alternatively, you can first insert your formula into the document, then carry out Steps 1 and 2 above replacing the sample formula with your formula.
When creating or editing a formula, the Math menu becomes available.
When creating formulas, take care about the font sizes to make sure they are similar in size to fonts used in the document. To change font attributes of a Math object, double-click in the formula to enter edit mode and go to Format > Font Size on the Menu bar. To change font type, use Format > Fonts.
For information on how to create formulas, see the Math Guide or Chapter 9, Getting Started with Math, in the Getting Started Guide.